Peakboard hub
Flows Overview
This section provides a central overview and control of your data projects within Peakboard Hub.
Sidebar: Peakboard Hub Flows and Flow Project Tree
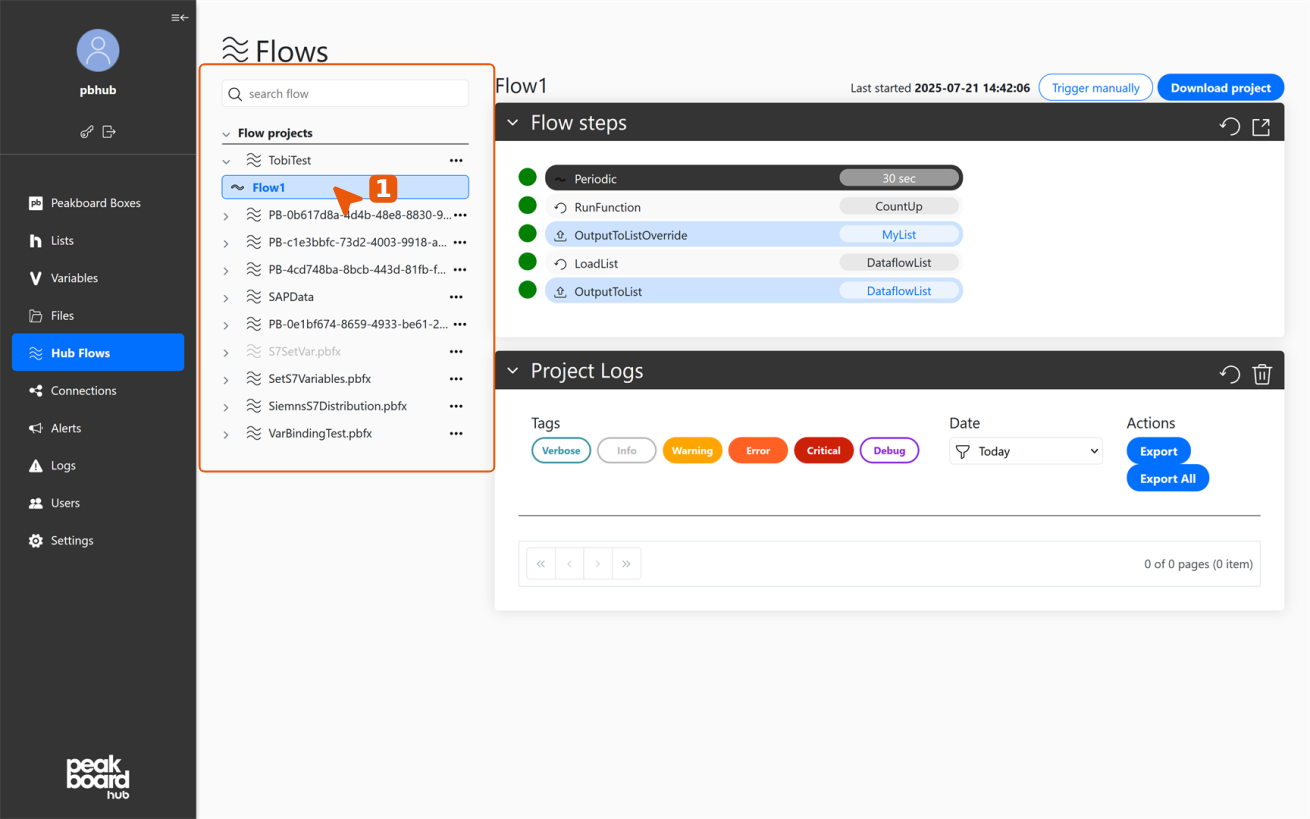
In the sidebar, navigate via [Peakboard Hub Flows] to existing data projects. Each project can contain one or more flows, displayed as nested entries below the respective project name. Click on a flow to open the detail view.
Header: Flow Control and Last Activity
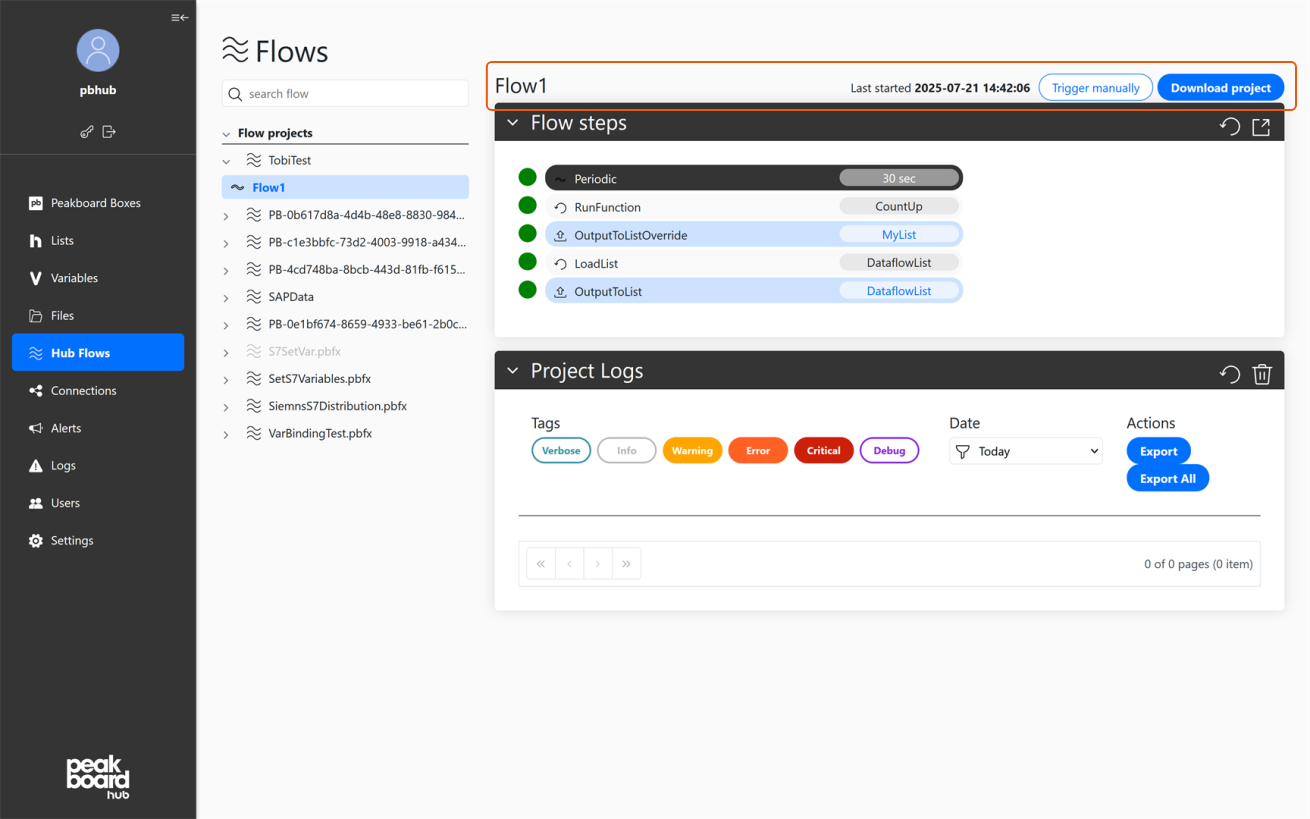
In the upper area of the workspace you will find the flow name, information about when the flow was last executed, and central control options:
- Trigger manually: Triggers the current flow immediately without waiting for the configured schedule or trigger.
- Download project: Exports the entire project for further editing in Peakboard Designer.
Flow Steps: Triggers, Actions, Outputs, Status Indicators
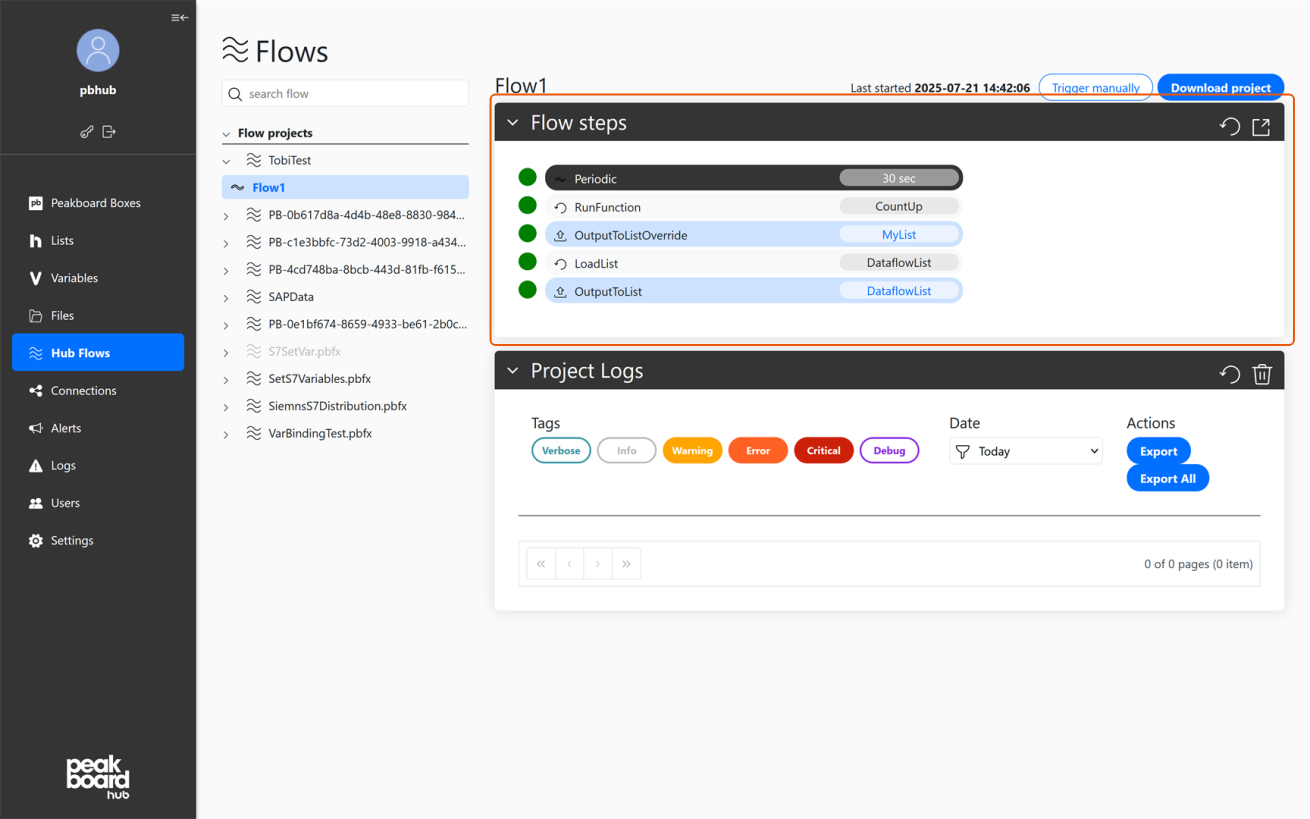
The [Flow steps] section shows the complete sequence of a flow:
- Trigger (gray background): Indicates how and how often the flow is triggered, for example [Periodic] for time-based execution.
- Normal steps (light gray): These items represent the main logic or processing steps within the flow.
- List outputs (blue marked): Steps that generate and save output data such as Peakboard Hub lists. These lists are read-only and serve only as output within the flow.
Status indicators for individual steps:
- Green: Completed successfully without errors.
- Blue border: Step is currently being processed.
- Red: Step failed, followed by a brief error description.
Project Logs: Log Display, Filters, Export Functions
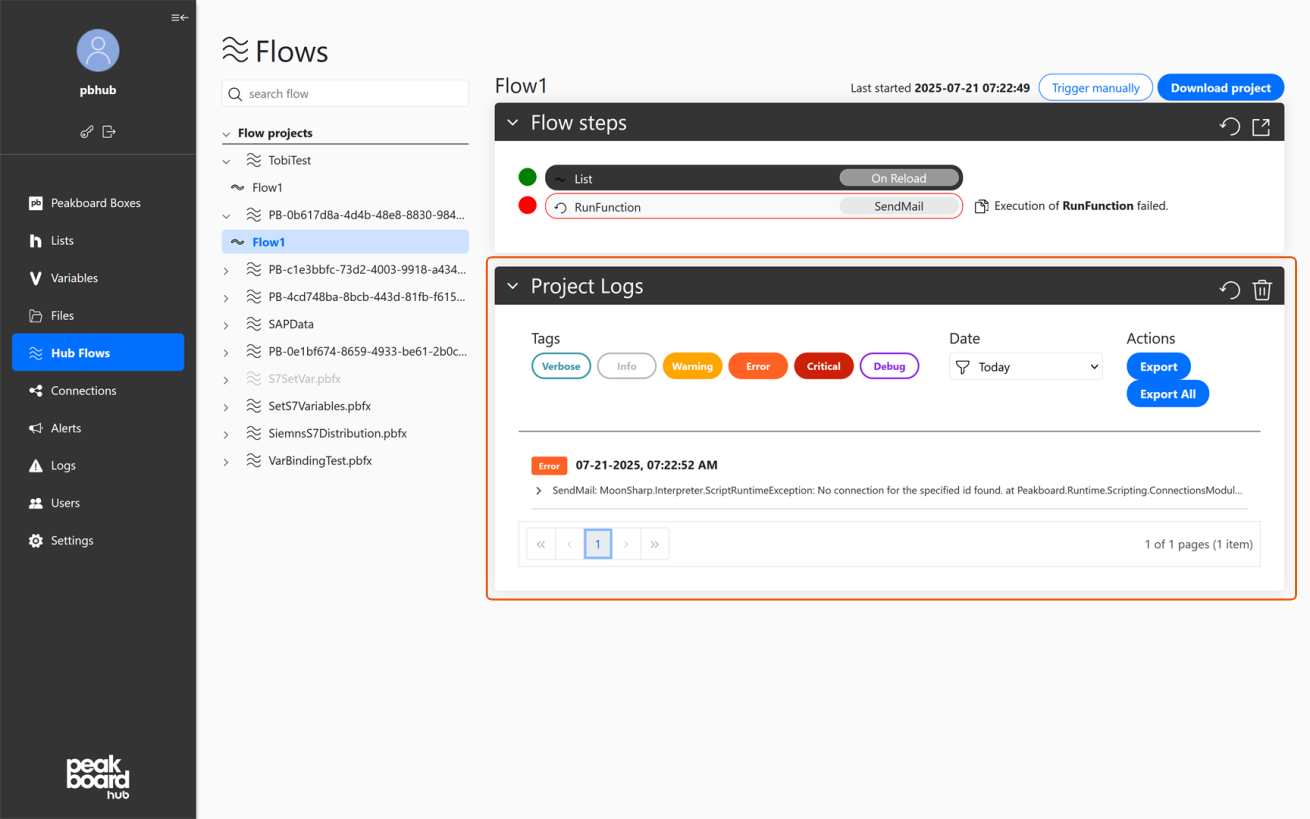
In the [Project Logs] section you will find all relevant event messages for the flows:
- Log tags: Use the color-coded buttons such as [Verbose], [Info], [Warning], [Error], [Critical], and [Debug] to filter the display by severity.
- Date filter: Change the date to see only messages from a specific time period.
- Export functions: Use the [Export] or [Export All] buttons to export the displayed or all logs for further analysis.