Data sources
Google Spreadsheets
The Google Spreadsheets data source is used to retrieve tabular data from Google Spreadsheets for further use in Peakboard.
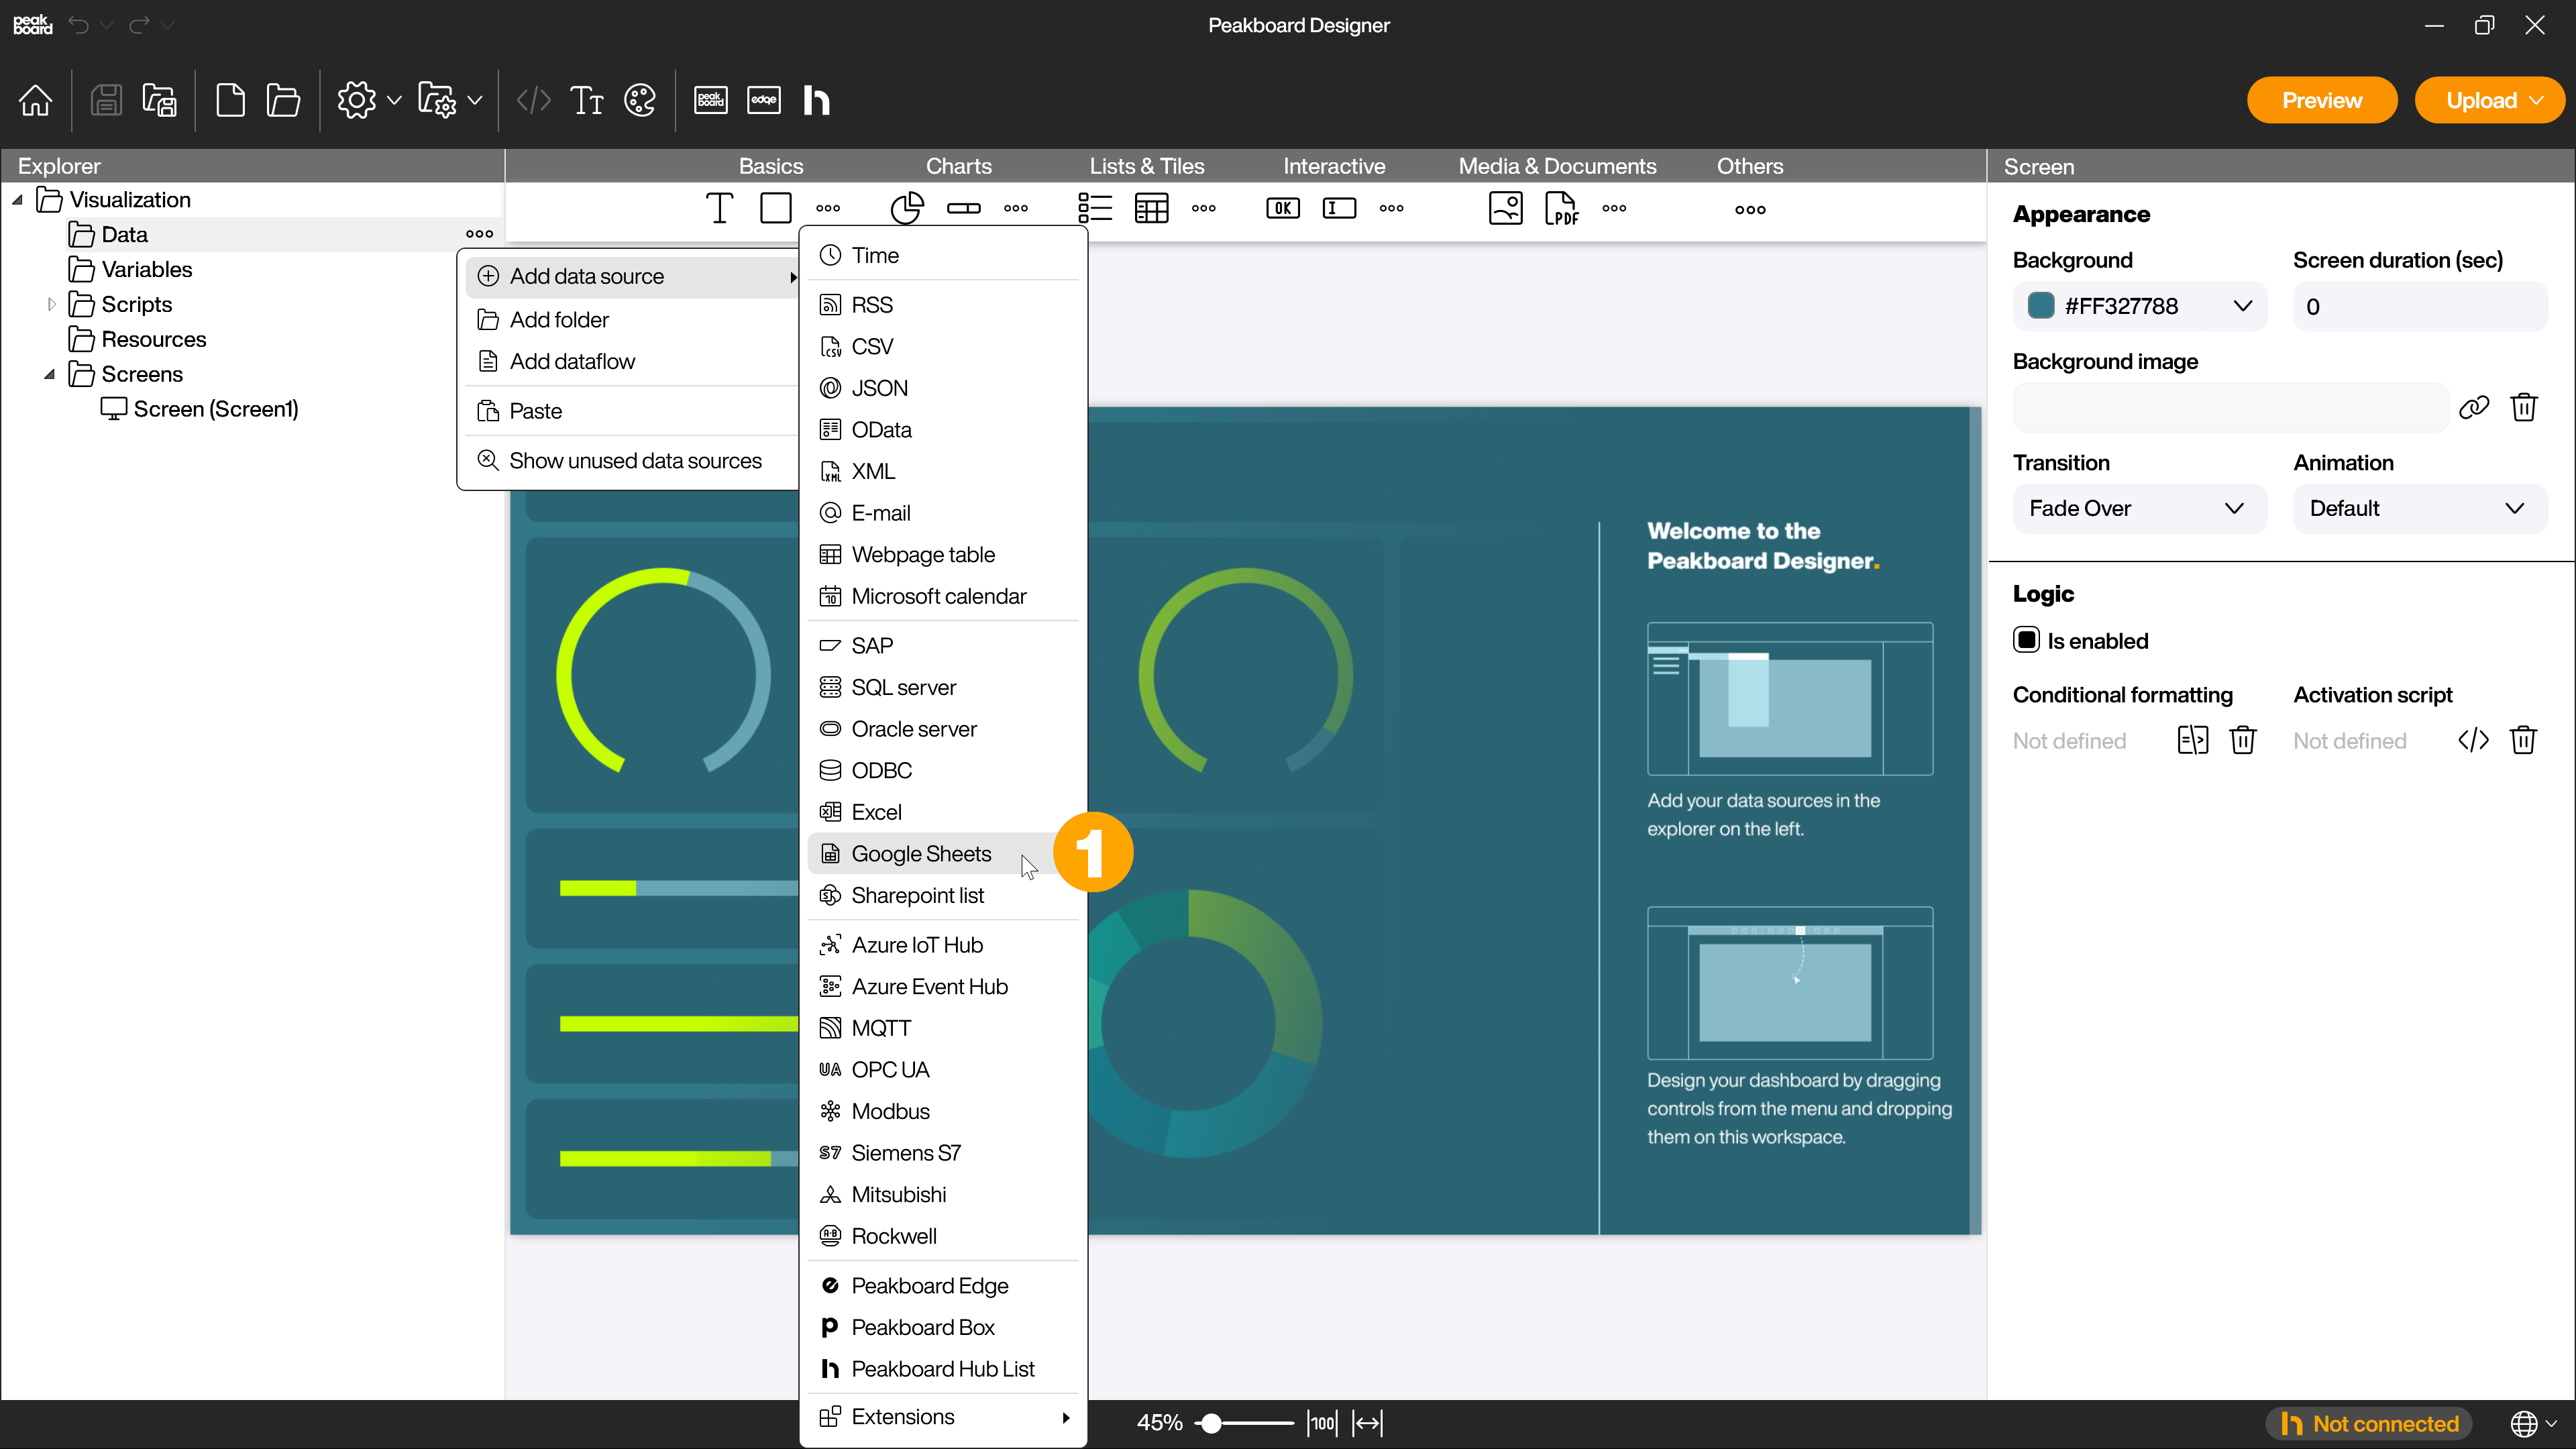
To add the data source, right-click on [Data] or alternatively click on the […] button and then select [Add data source] and [Google Spreadsheets] (1).
Authorize access to Google
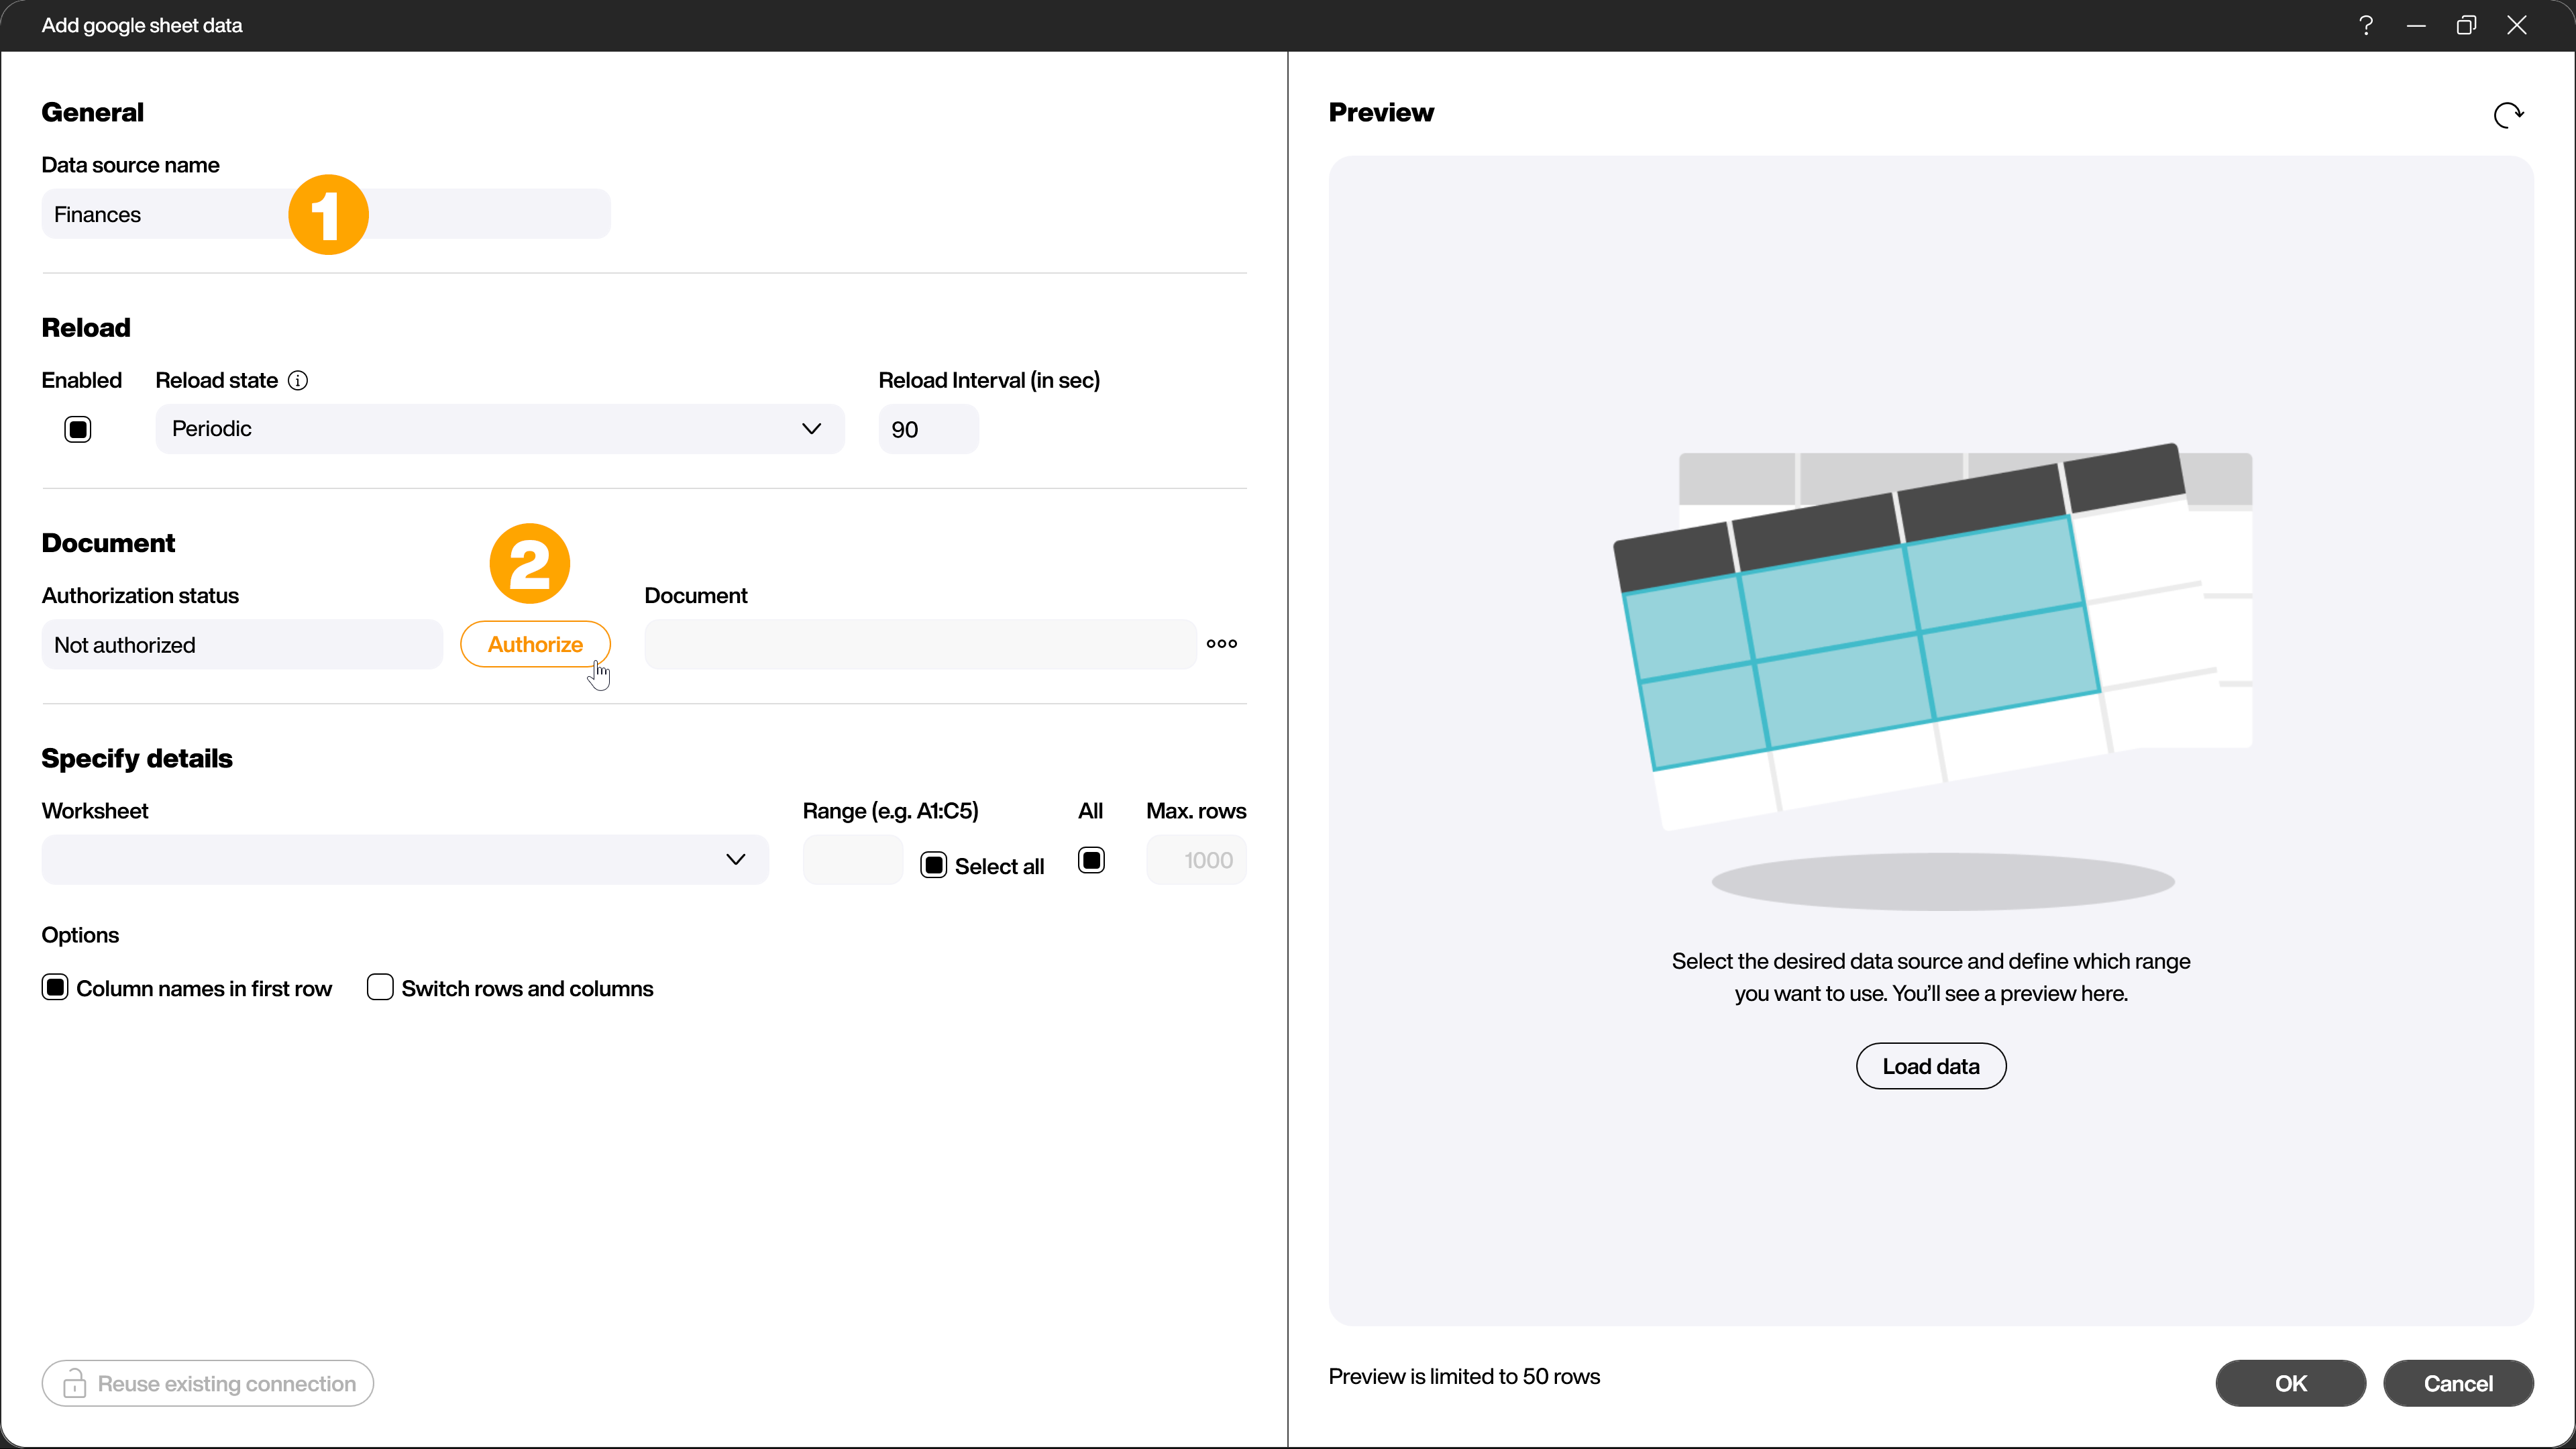
Give the data source a name (1). After that you have to connect to a Google account. Click the [Authorize] button (2).
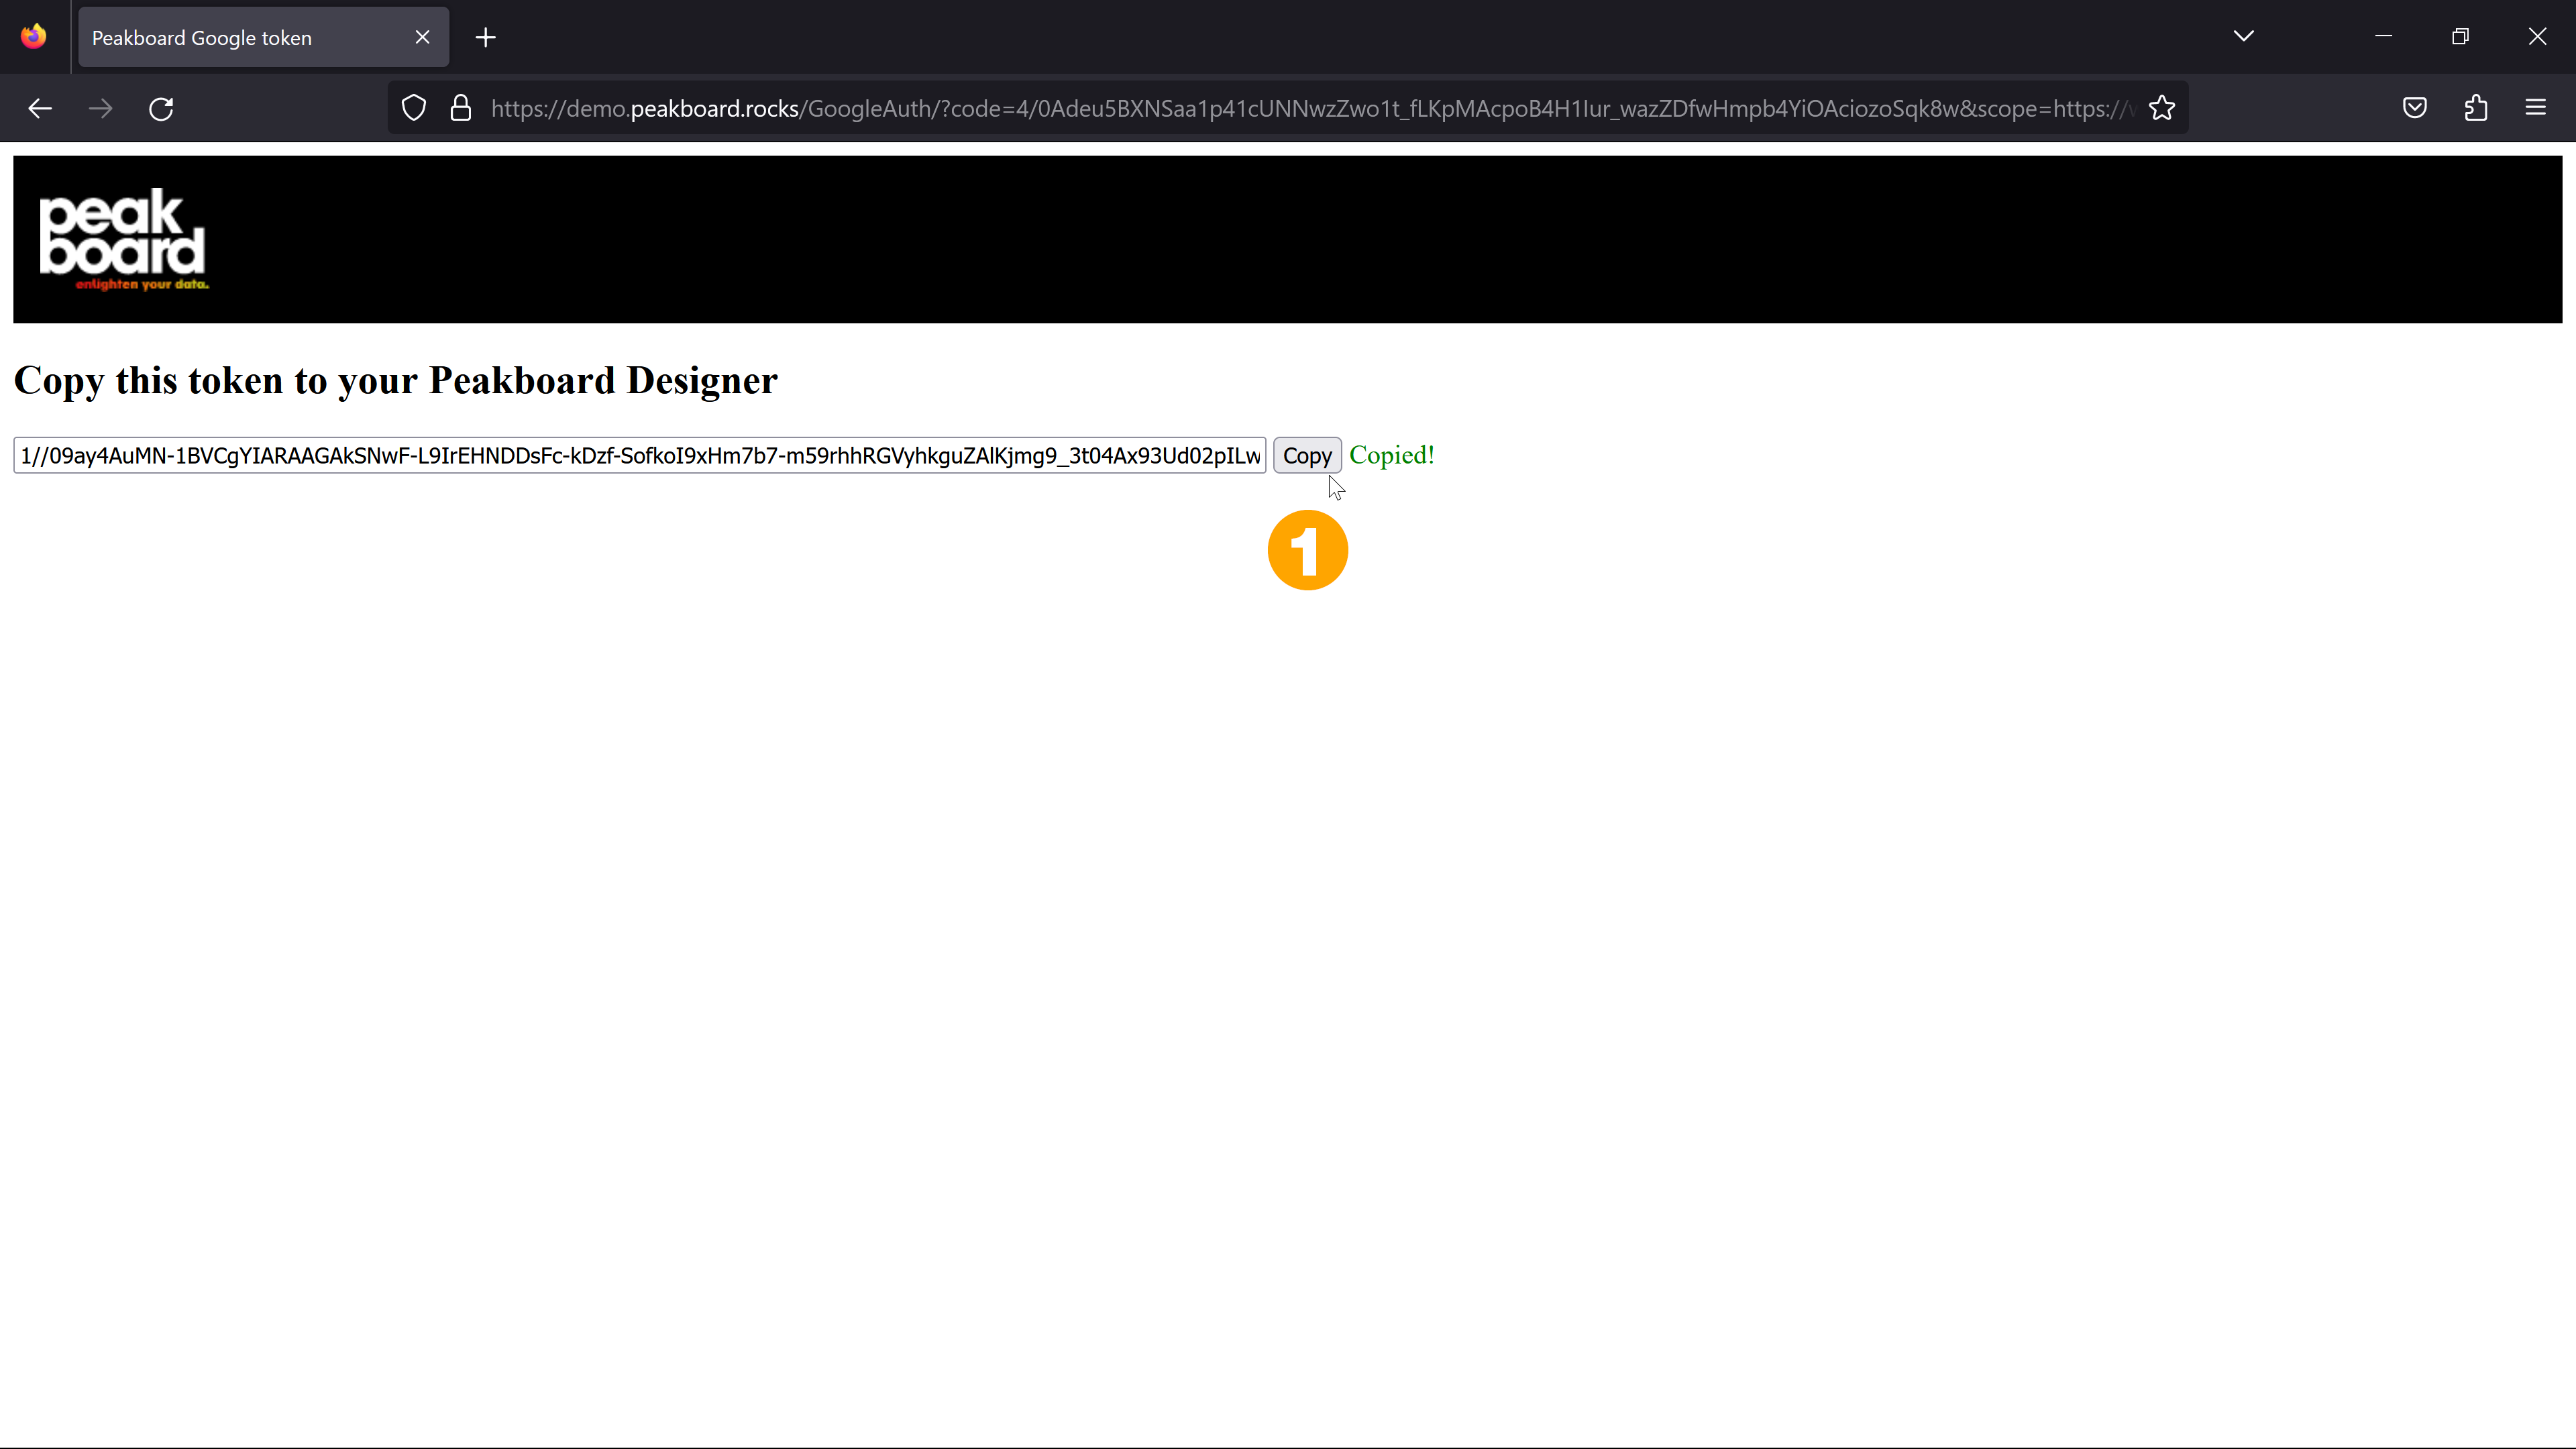
A login window will open where you have to enter your Google credentials. This gives the Peakboard Designer the right to read tables as an application. Username and password are not stored in the Peakboard Designer. A token is generated which you store in the project and which is later transferred to the Peakboard Box. You can revoke this token for access at any time within your Google account. Copy the generated token (1).
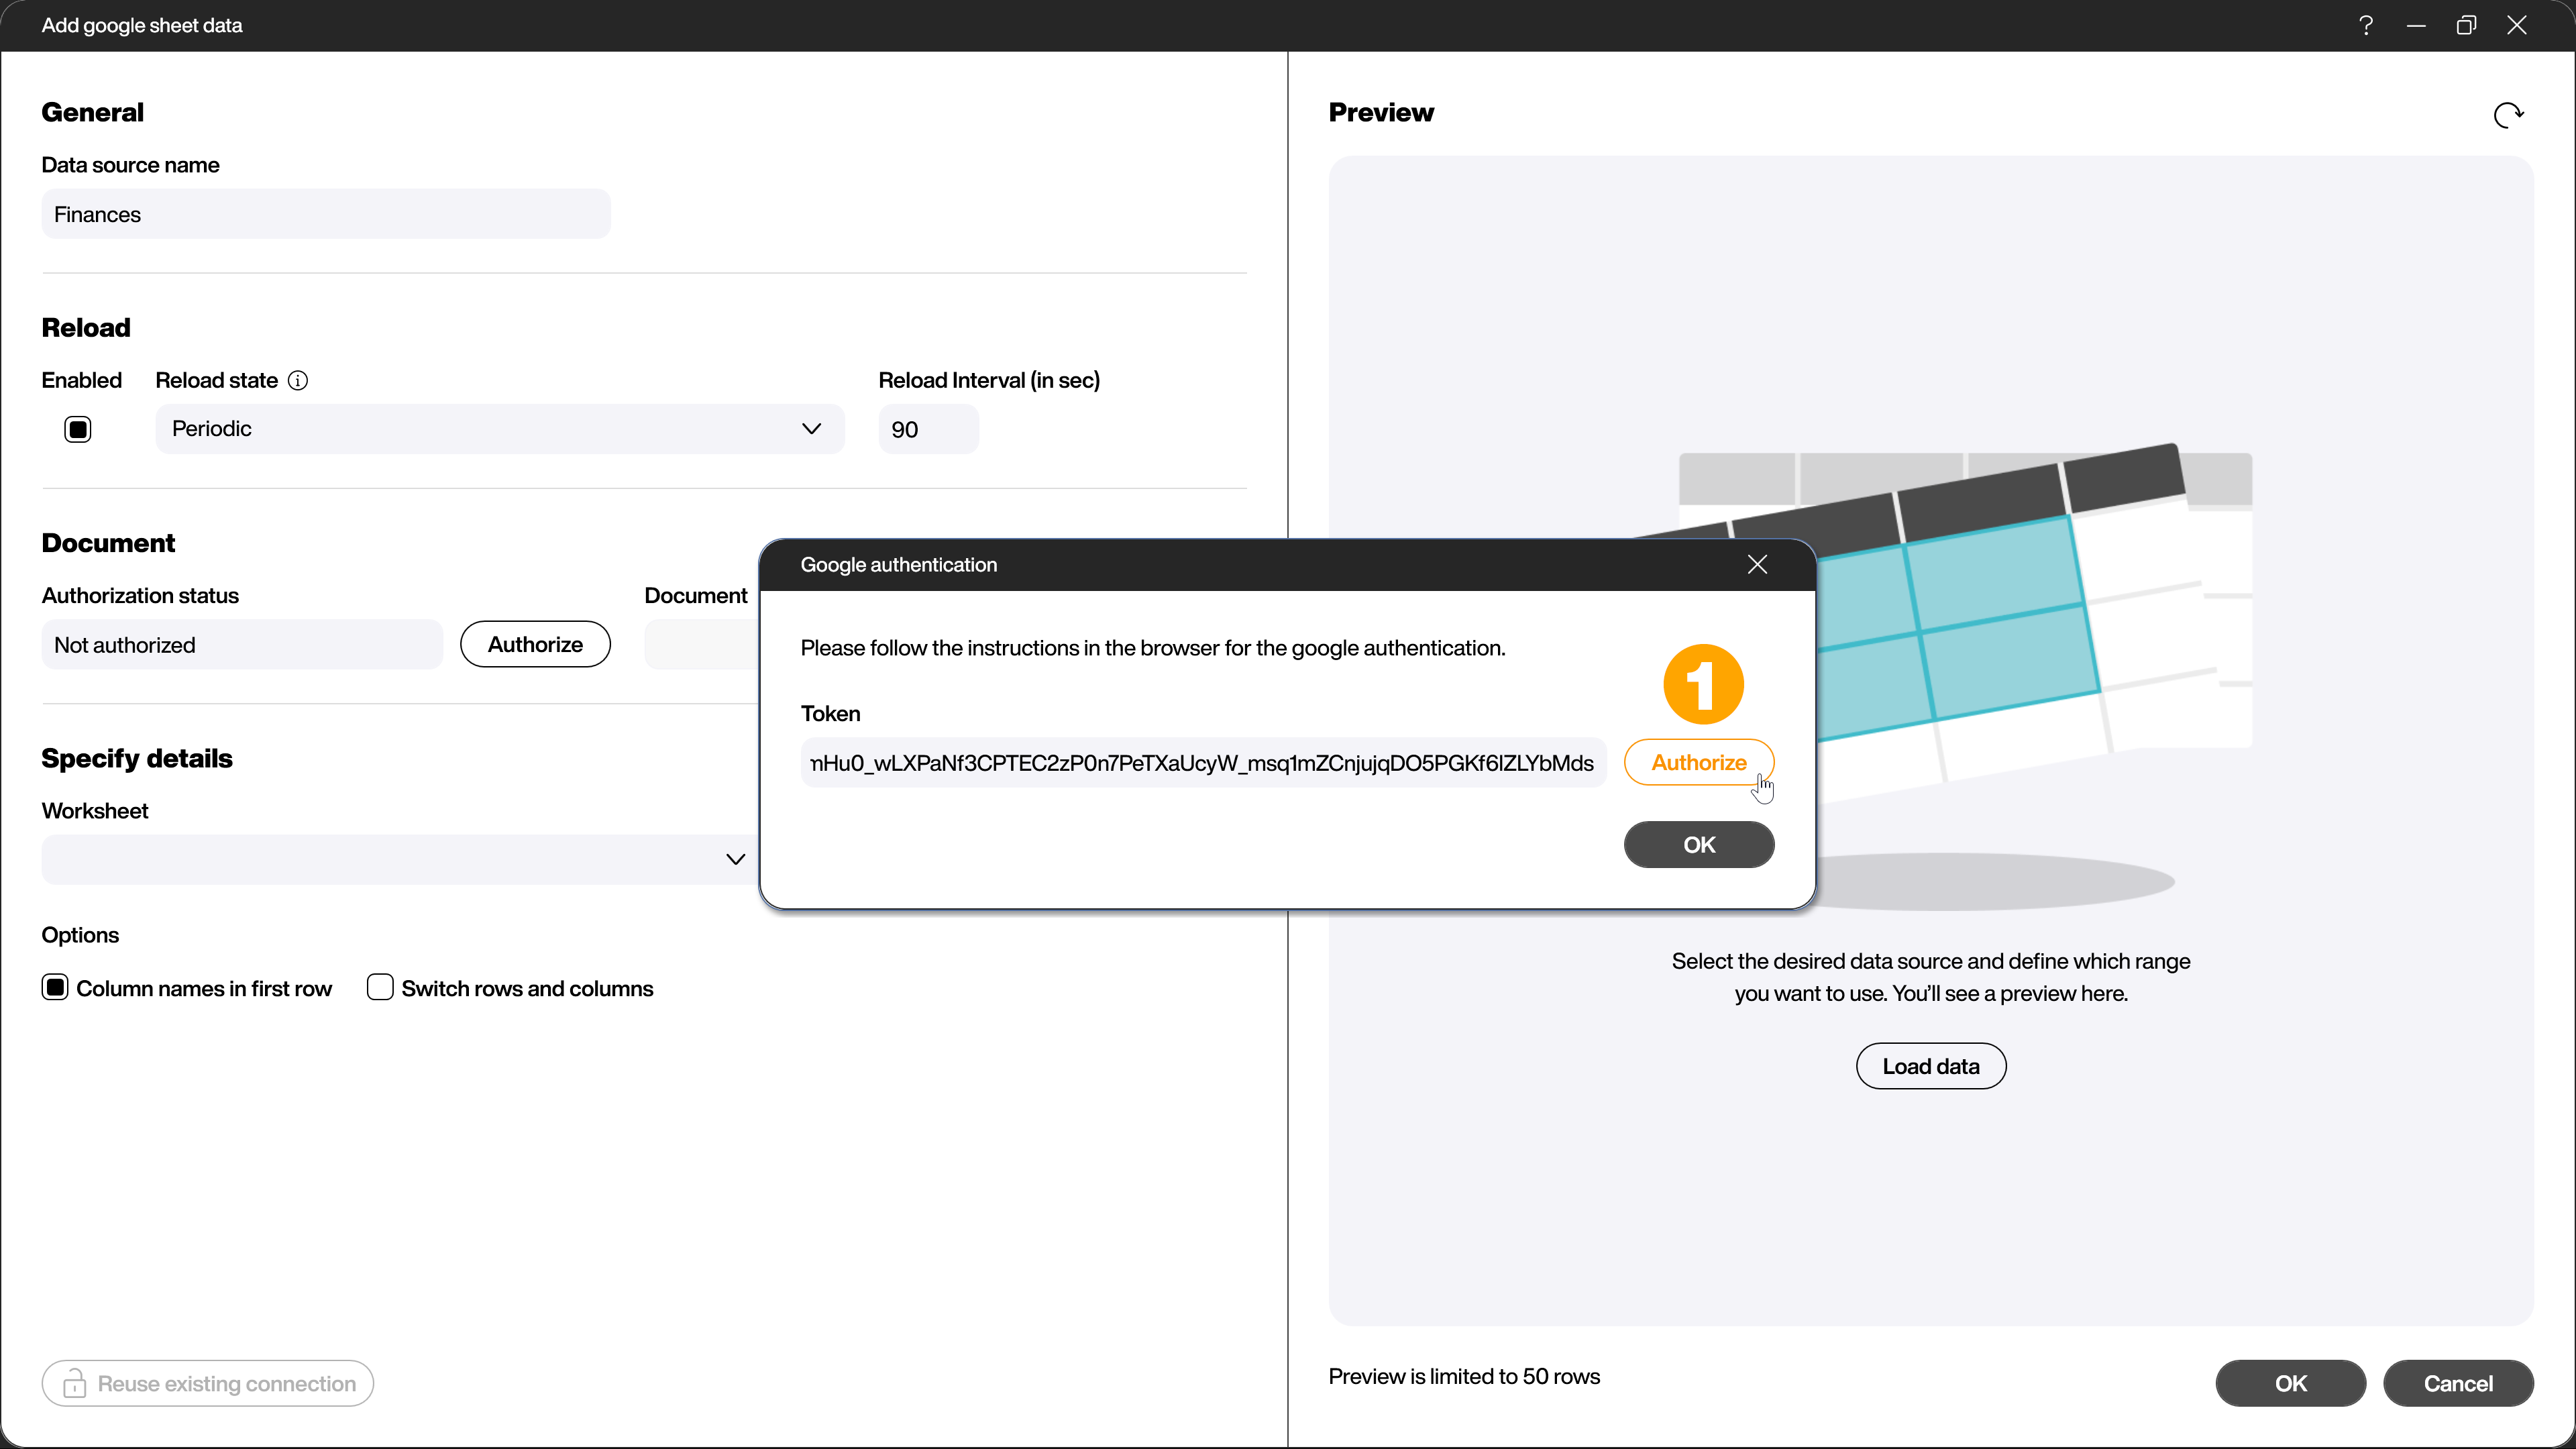
Paste the token in the Peakboard Designer and confirm the authorization (1).
Set up table access
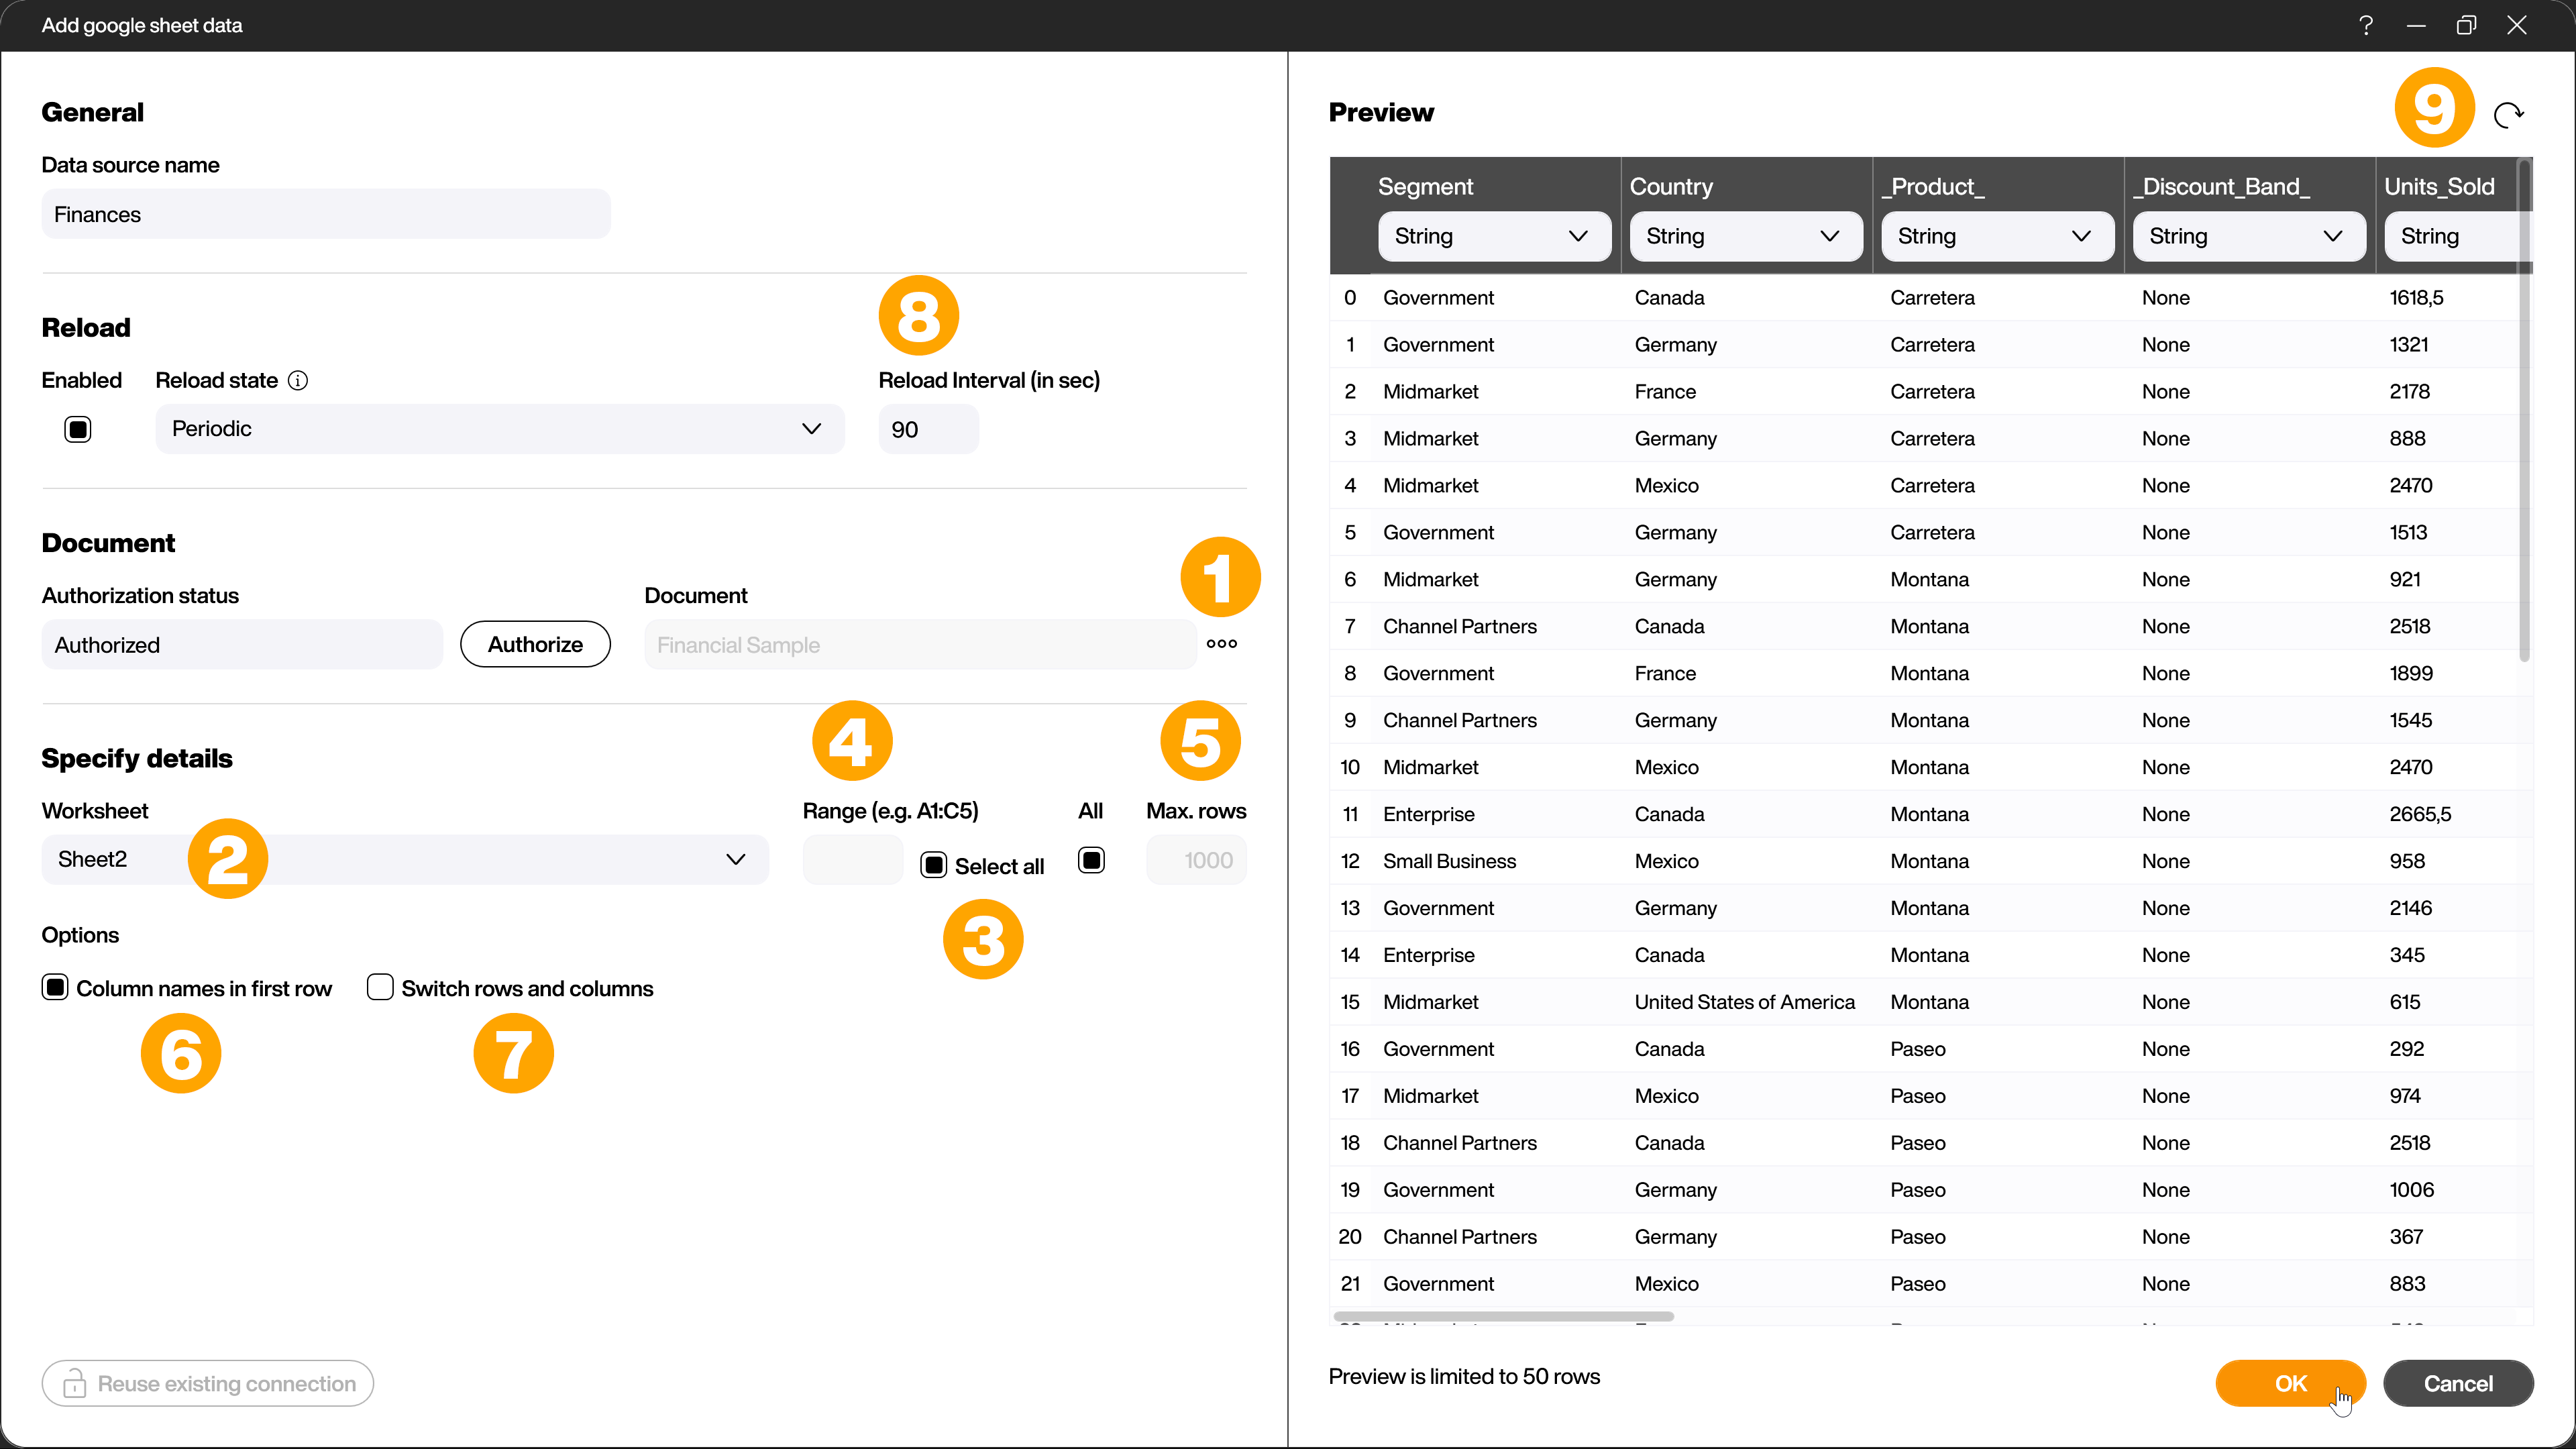
The […] button (1) allows browsing through the Google Drive folder structure that contains the tables. After selecting them with a double click, the path and file name will be copied to the corresponding text field.
In order to now select the correct section from the spreadsheets as the data basis, the following settings are possible:
- Worksheet (2) here you define which worksheet from the selected document should be used if several are available.
- Select all (3) means that all data of a worksheet will be selected and not only a certain section.
- Range (4) you can specify this value if only a certain section of the worksheet is to be read. The notation is as usual in Excel e.g. A5:C26.
- Max. rows (5) defines the maximum number of rows to be read, provided that no range is specified.
- Column names in first row (6) means that the column contents of the first row are used as headers for the output columns.
- Swap rows and columns (7) treats the rows and columns each in reverse, just like a pivot table.
With the [Reload interval] (8) you define the time interval for the automatic reloading of the data in seconds. A click on [Load data] (9) shows you a preview of the data according to the settings and updates the metadata in the column list.