Controls
Timeline grid
The idea of the timeline grid is to display different states over time. You can use data that contains either timestamps or a duration.
For example, the timeline Grid can be used for a machine that has the states Setup (01), Production (02) and Error (03). The aim is to create a representation over time that shows the individual states at a glance.
Data basis
Two static lists are used as the data basis in the following example. In real use, however, any dynamic data source can be used that contains all the necessary information or has been prepared appropriately.
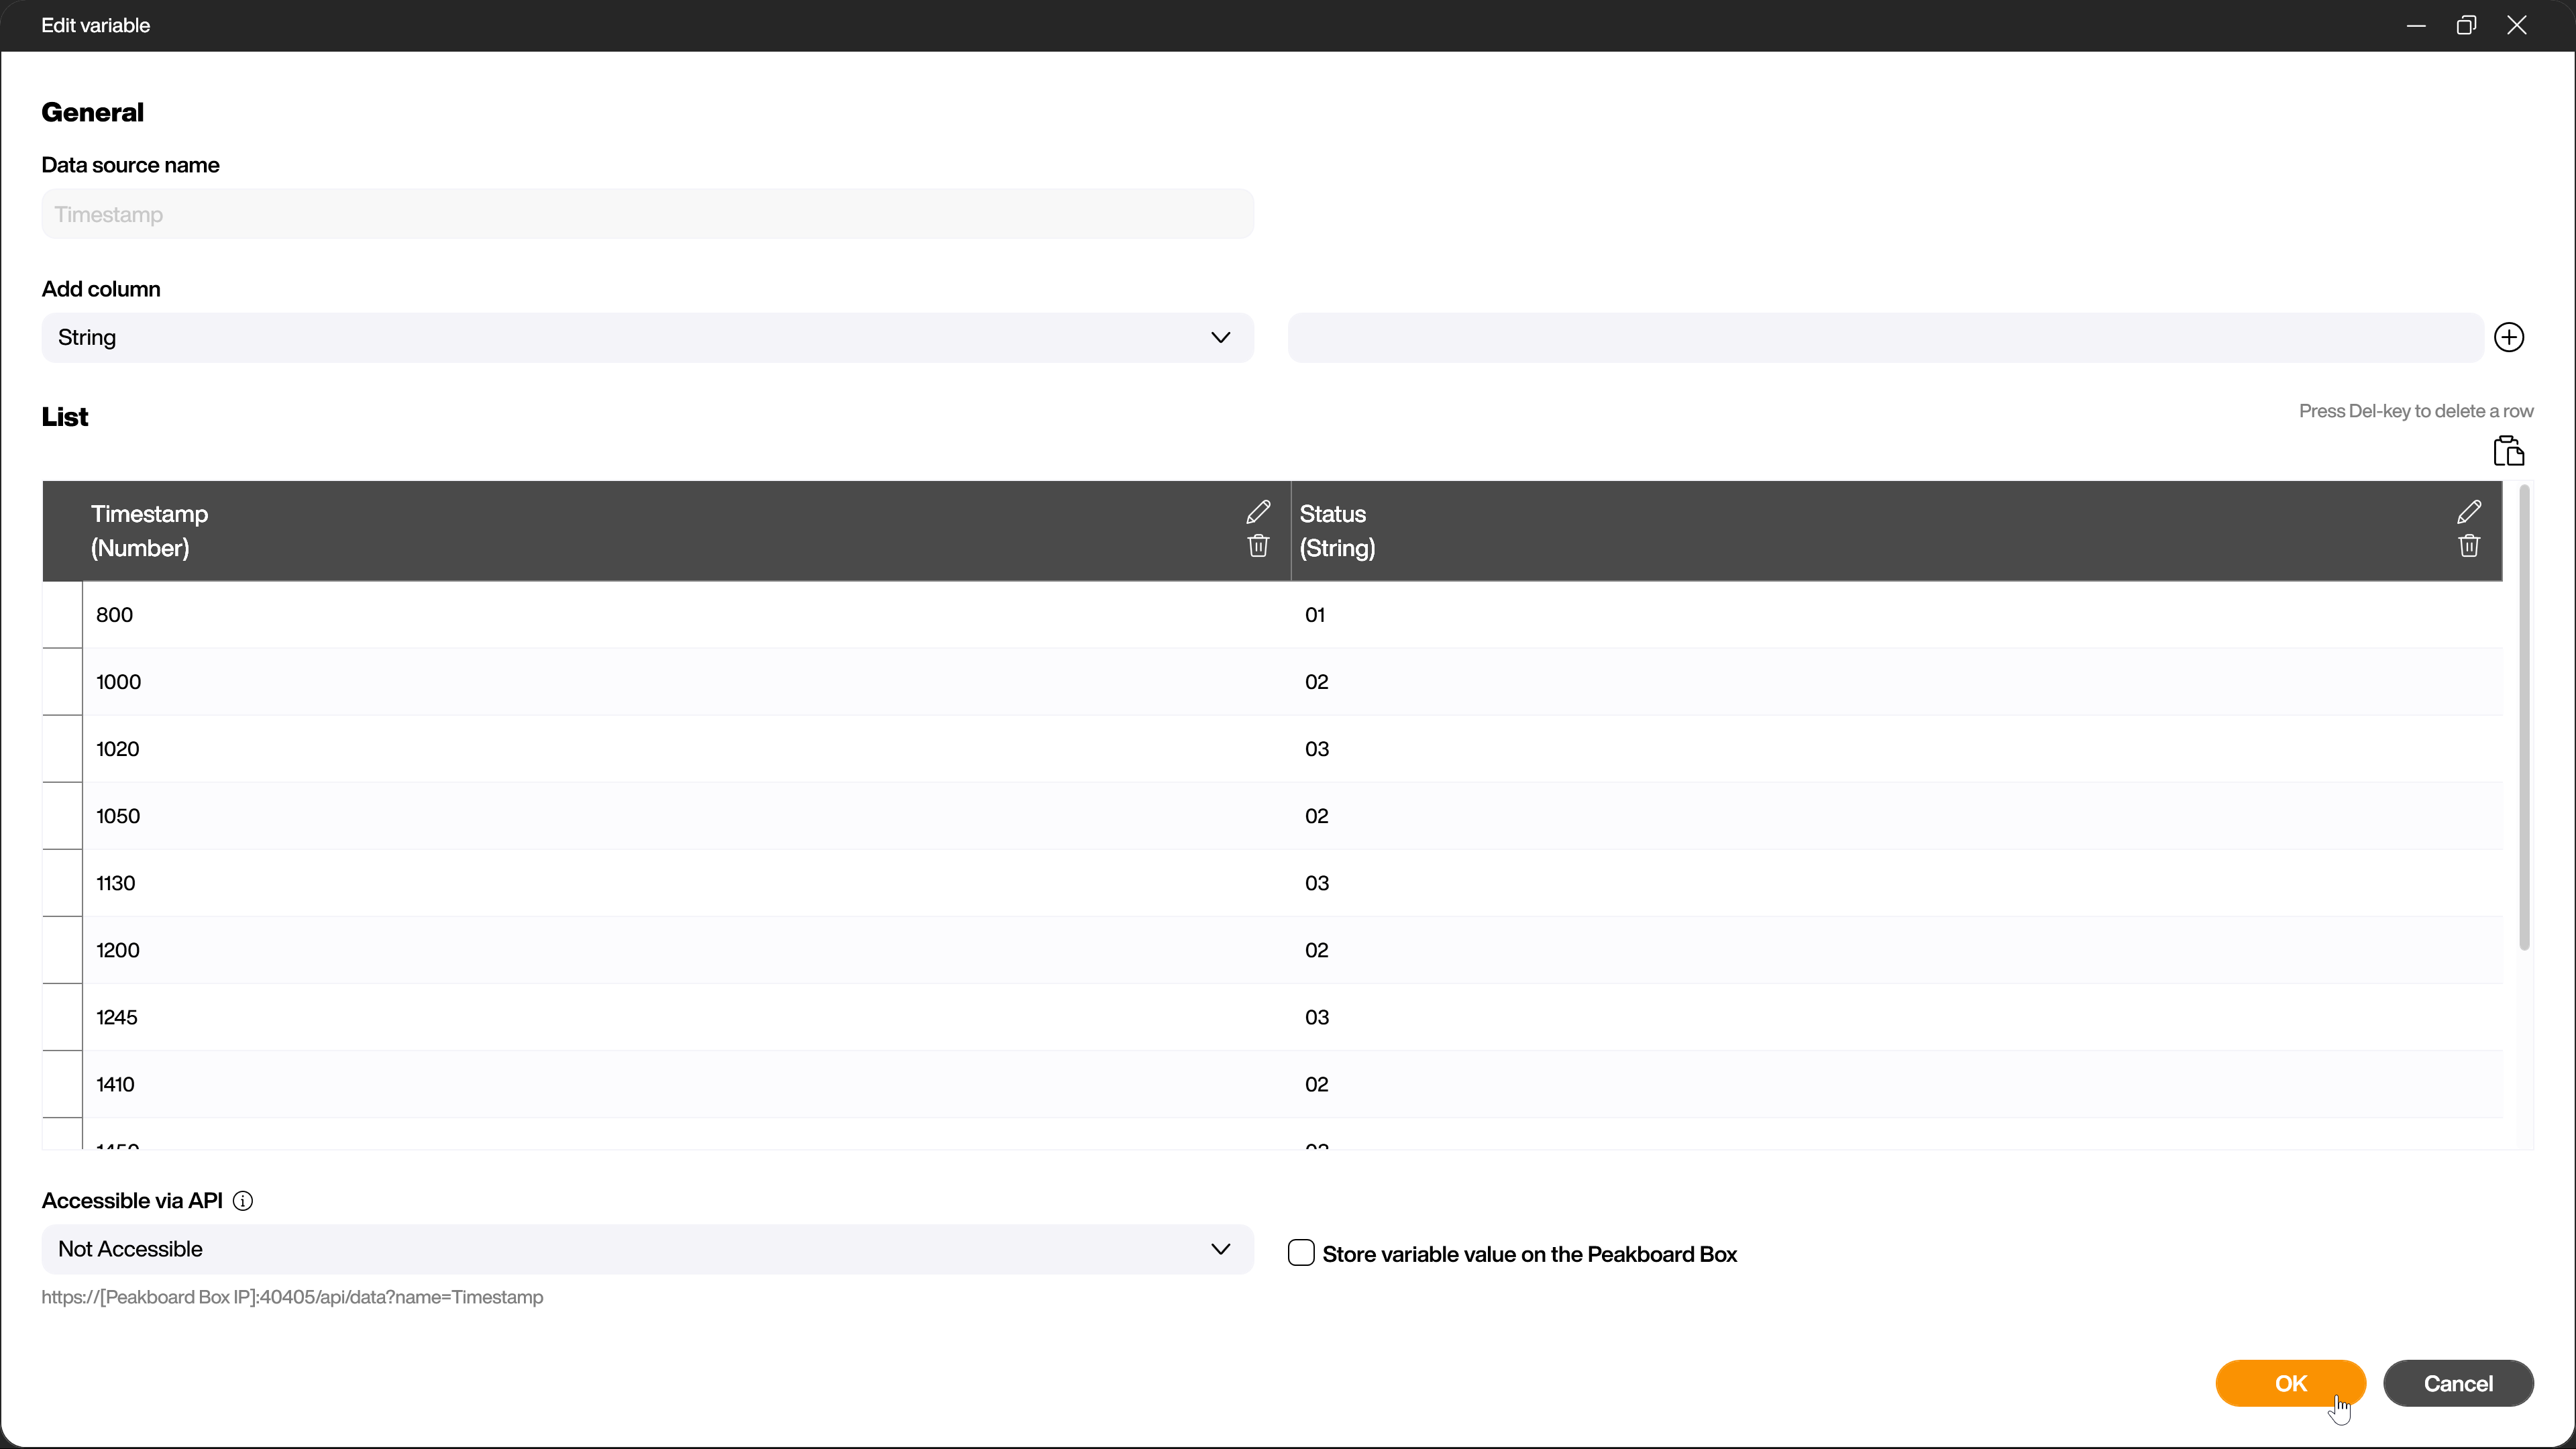
In the example, the [Timestamp] list contains a column of data type number with the timestamps in the format HHmm. The second column of data type string contains the respective status (01-03) that started at this timestamp.
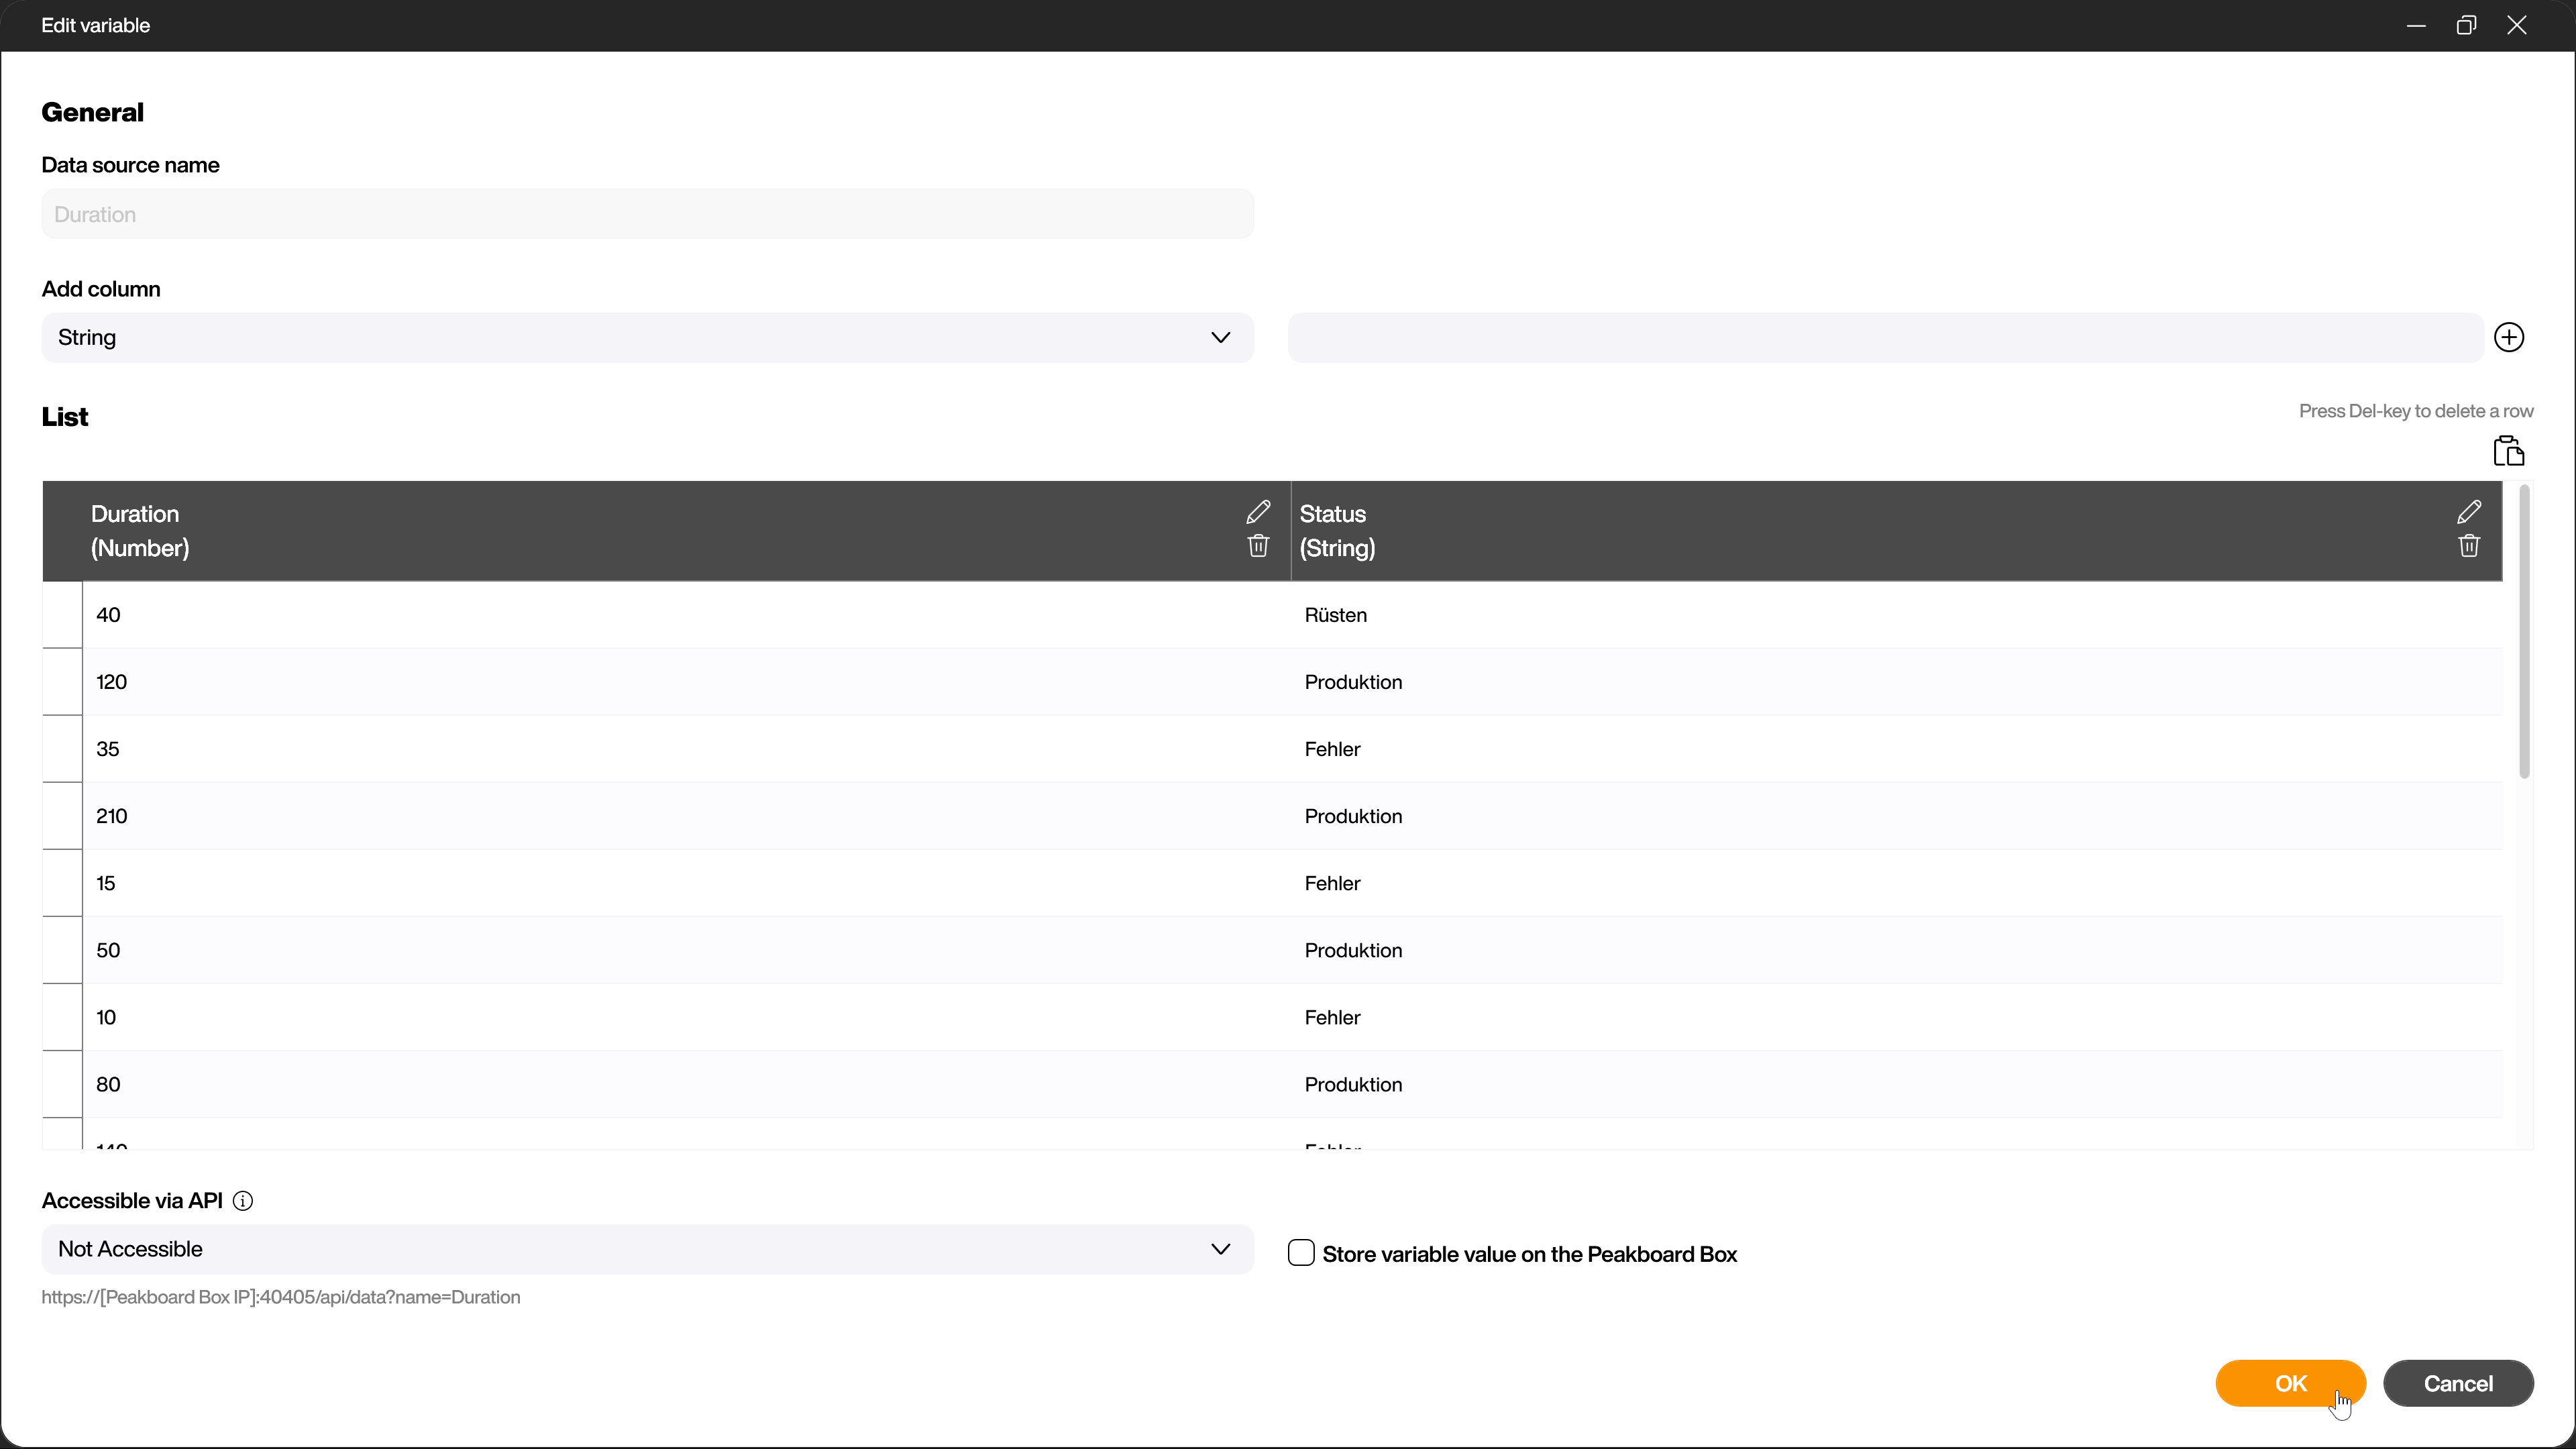
The [Duration] list also contains a column of the number data type. This contains the duration of how long the respective statuses have lasted. The second column in this list of type string contains the respective status (01-03) as in the first list.
Add and prepare the control
To add the timeline grid to your project, drag and drop it onto the workspace. You will find the timeline grid (1) in the [Charts] area.
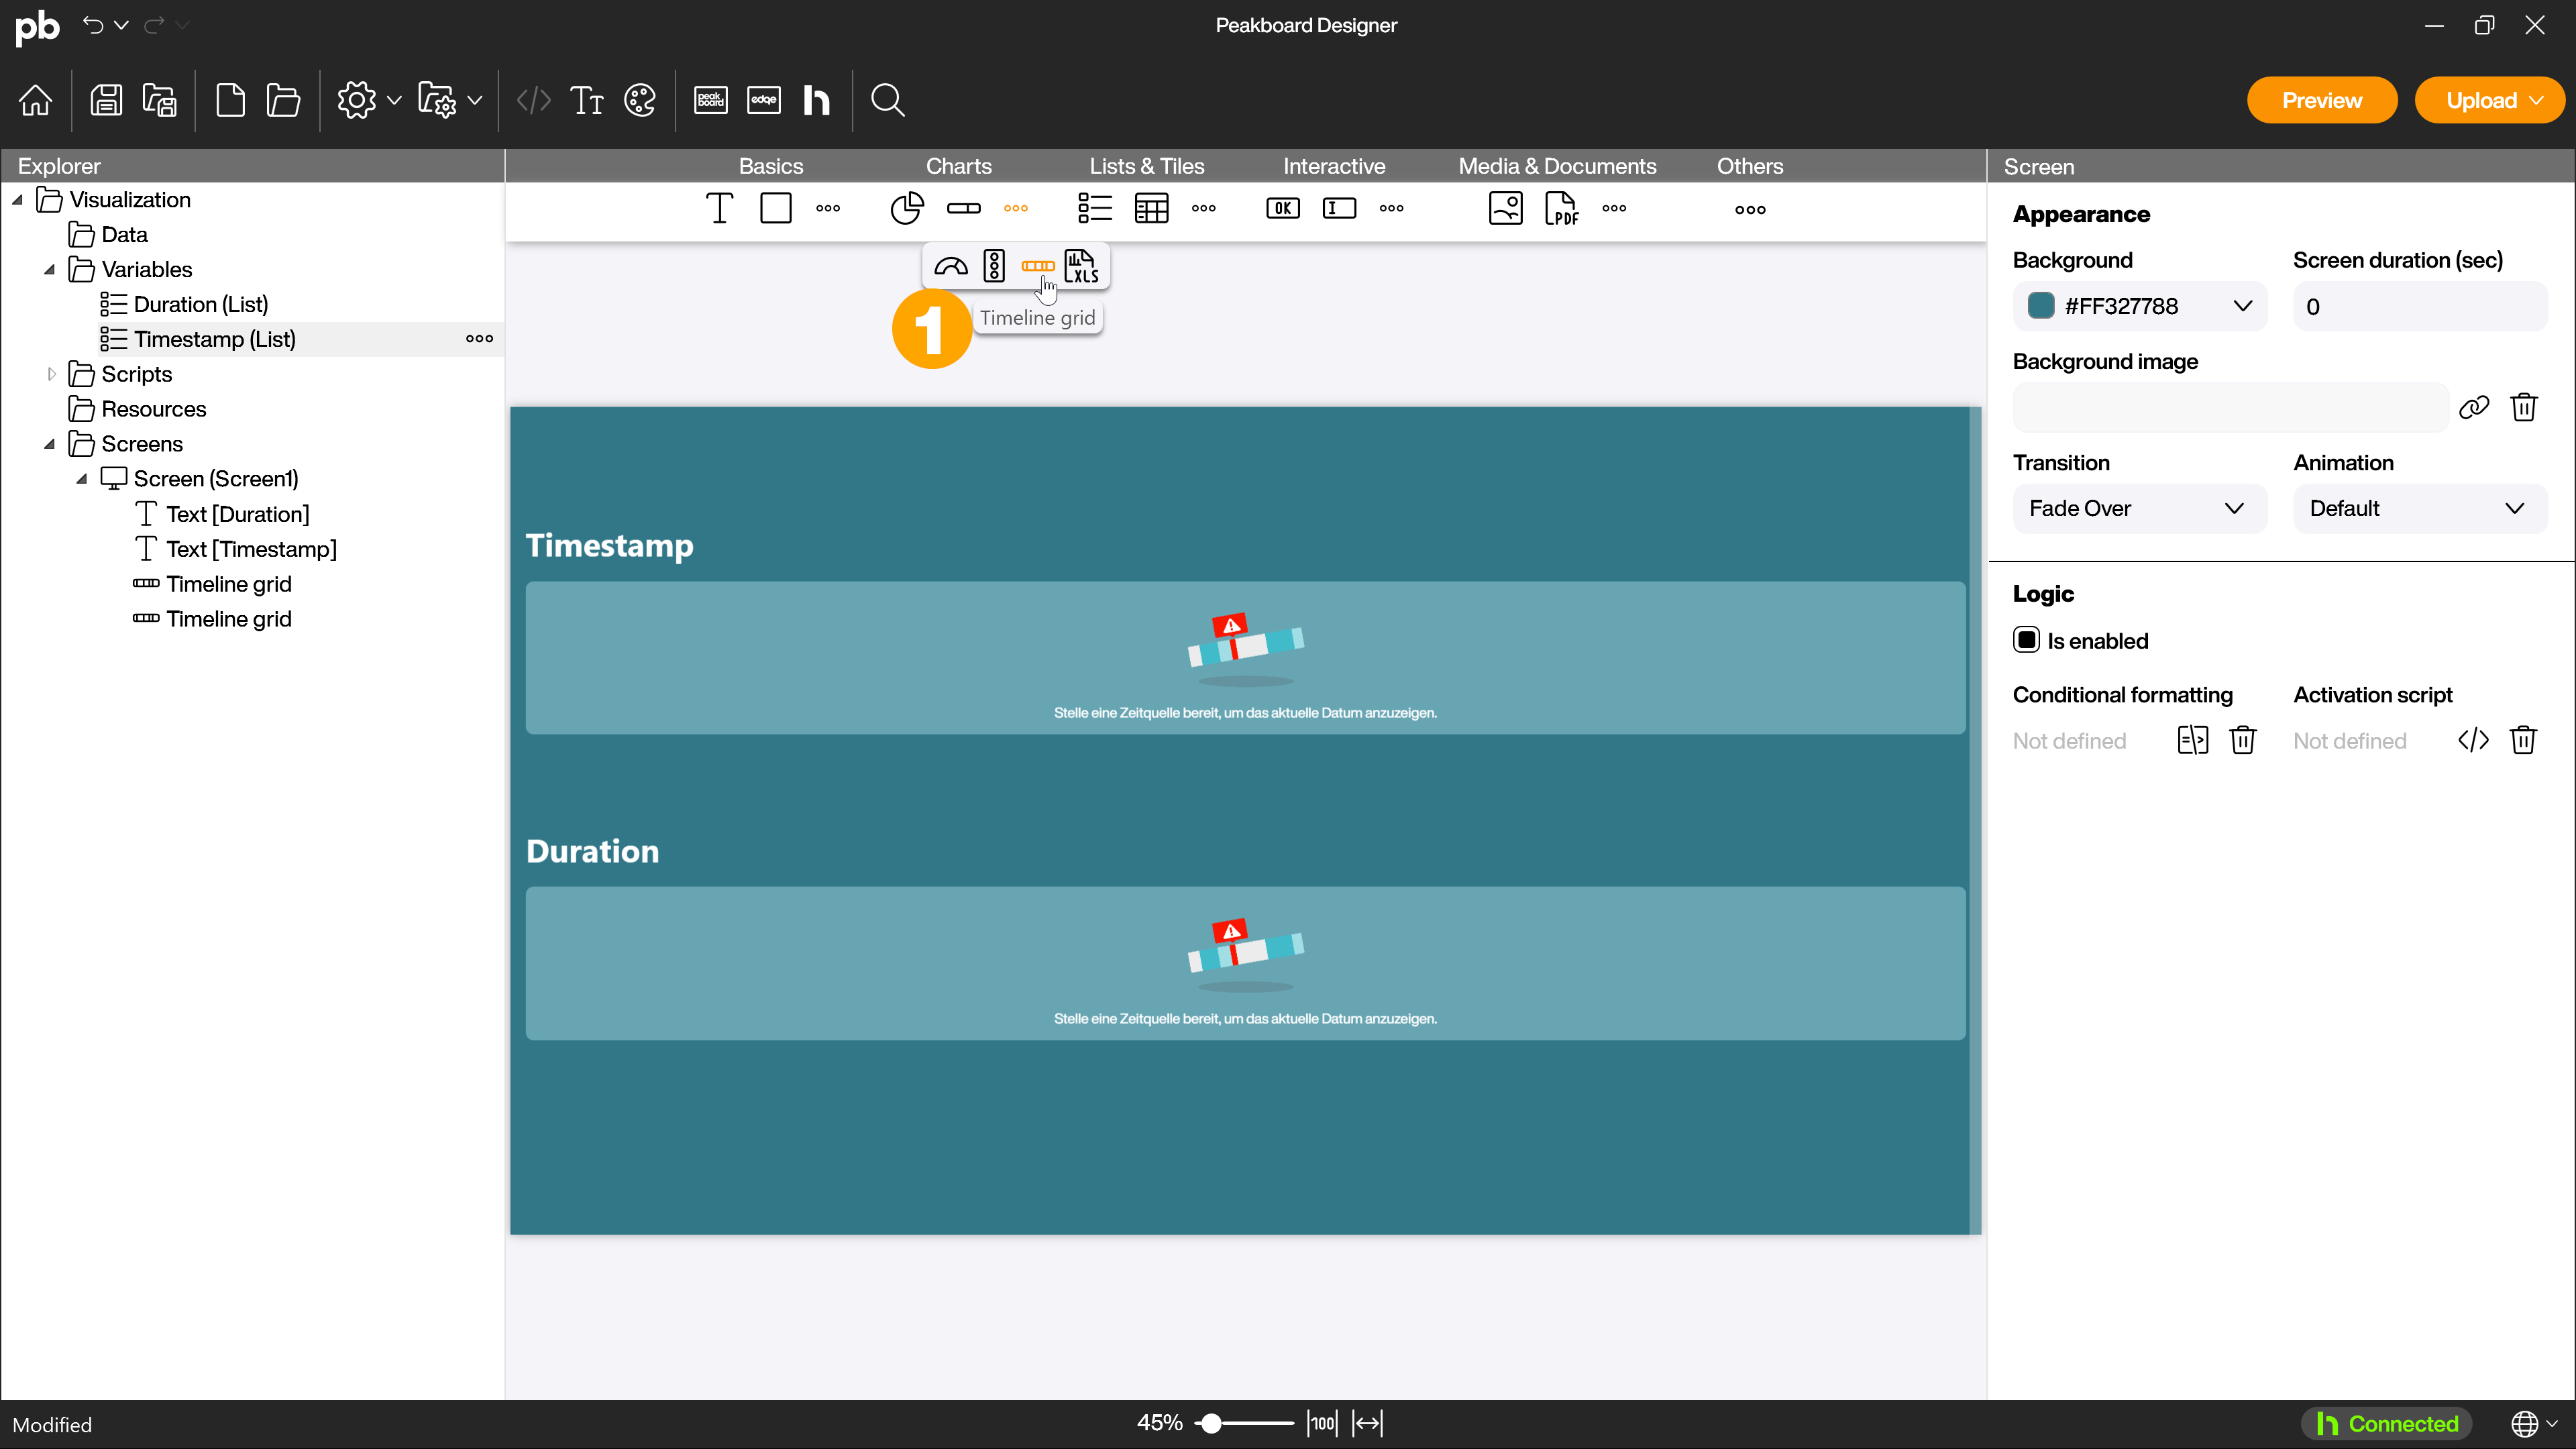
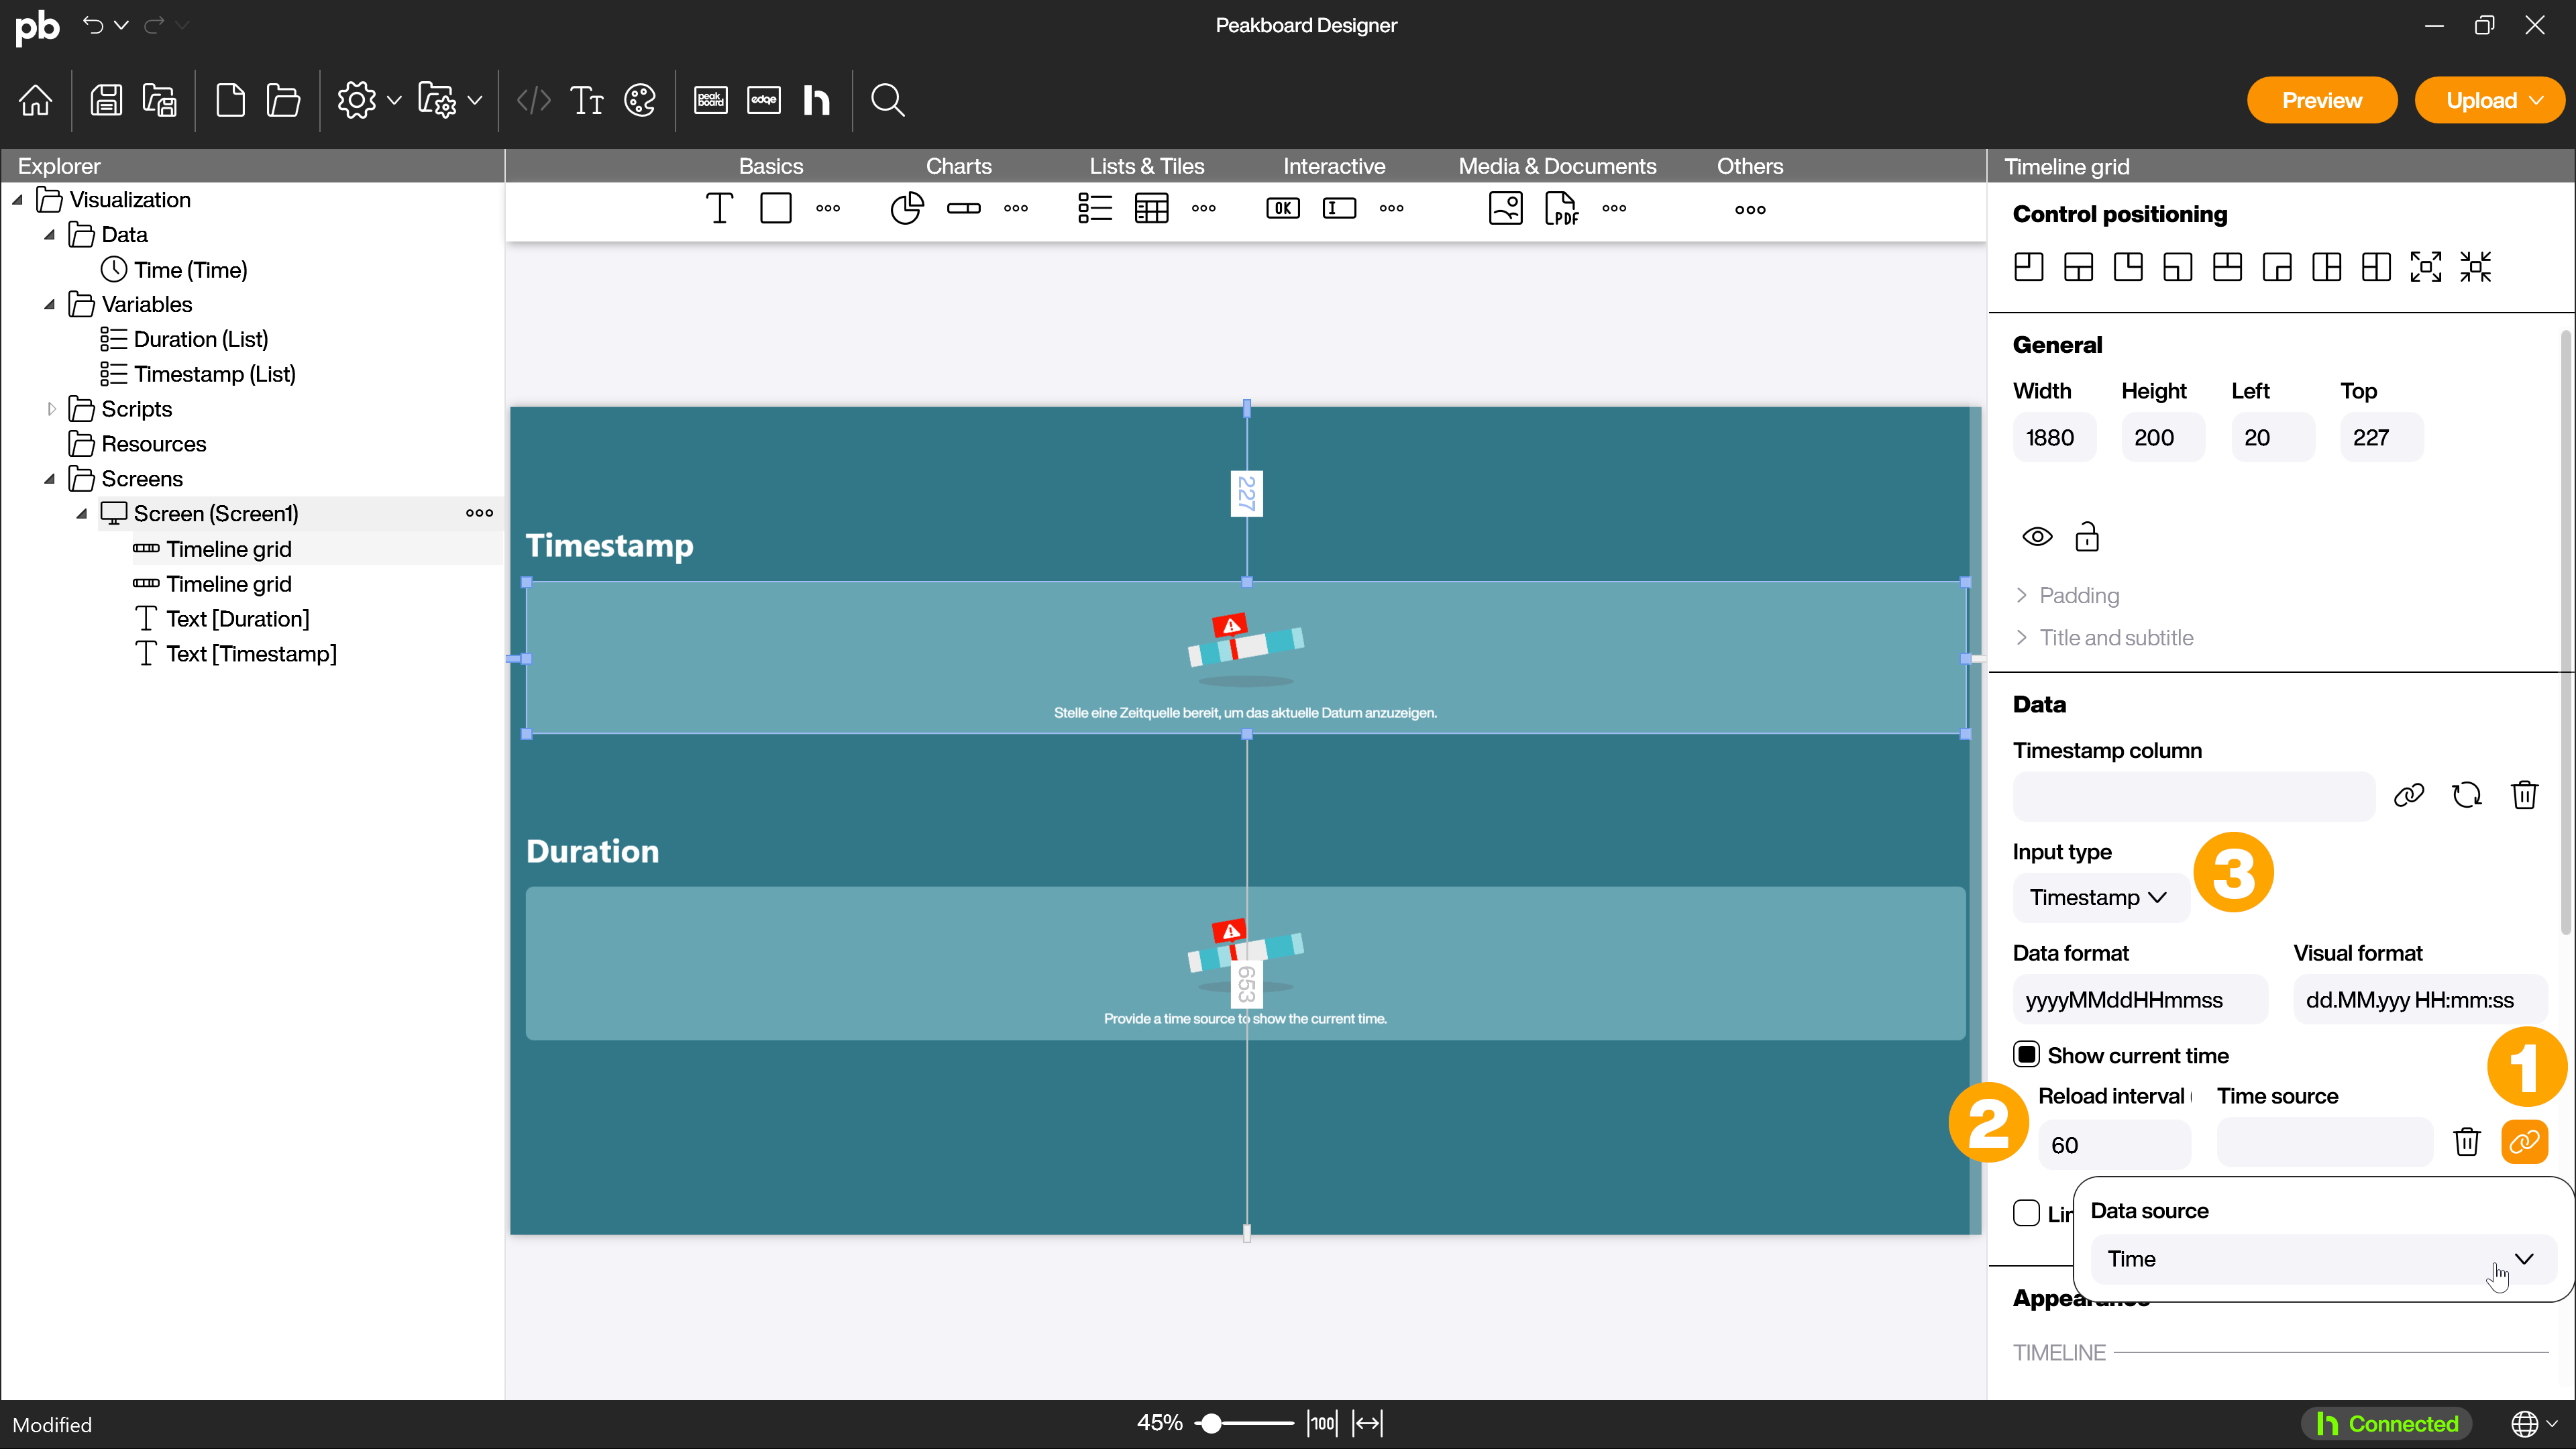
As you can already see from the empty graphic of the control, you need a time data source to use the timeline grid. It is used to display the current time. In the [Data] area, you can link it to the timeline grid control under [Show current time] by clicking on the link symbol (1). Also define your [Reload interval] (2) in seconds there. Next, define the input type (3) that you want to use for the timeline grid.
Input type: Timestamp
This is the input type that is used more frequently. The prerequisite for use is a column with timestamps in the data source. With the timestamp input type, you have the option of limiting the time axis. For example, you can display work shifts between fixed times.
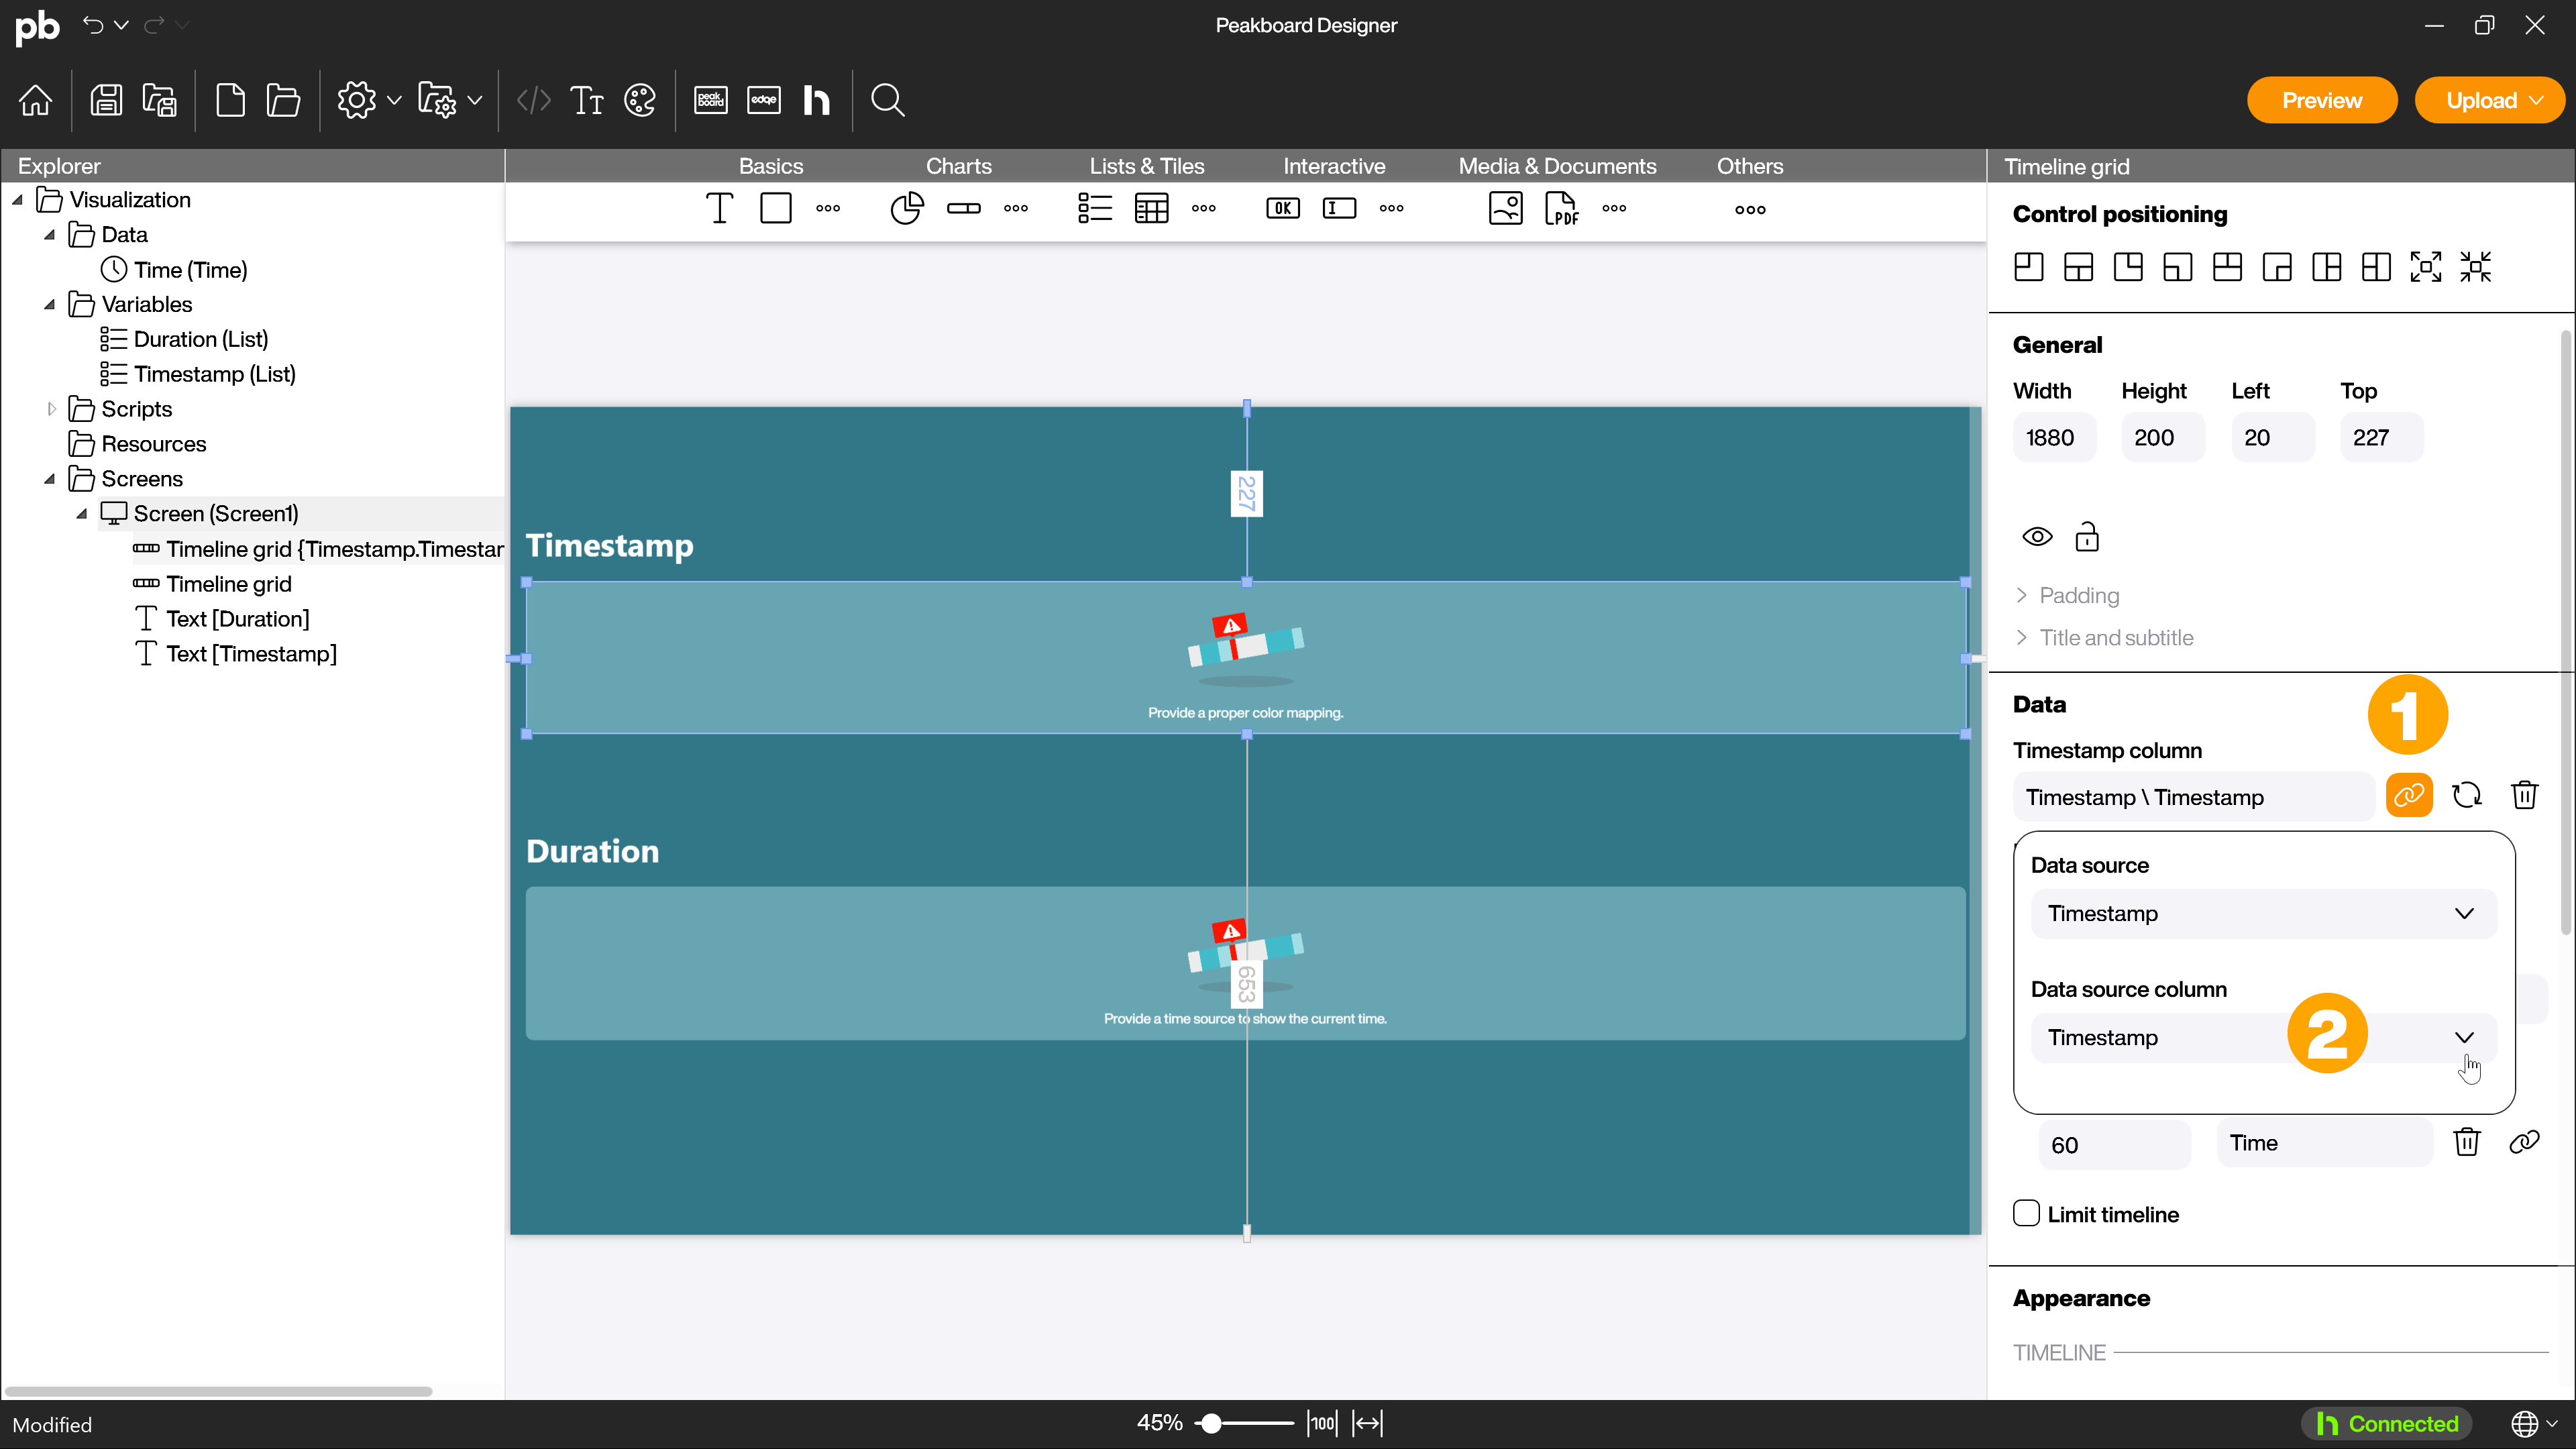
First, link the data source with the link icon (1) in the [Timestamp column] area and select the column that contains the timestamps (2).
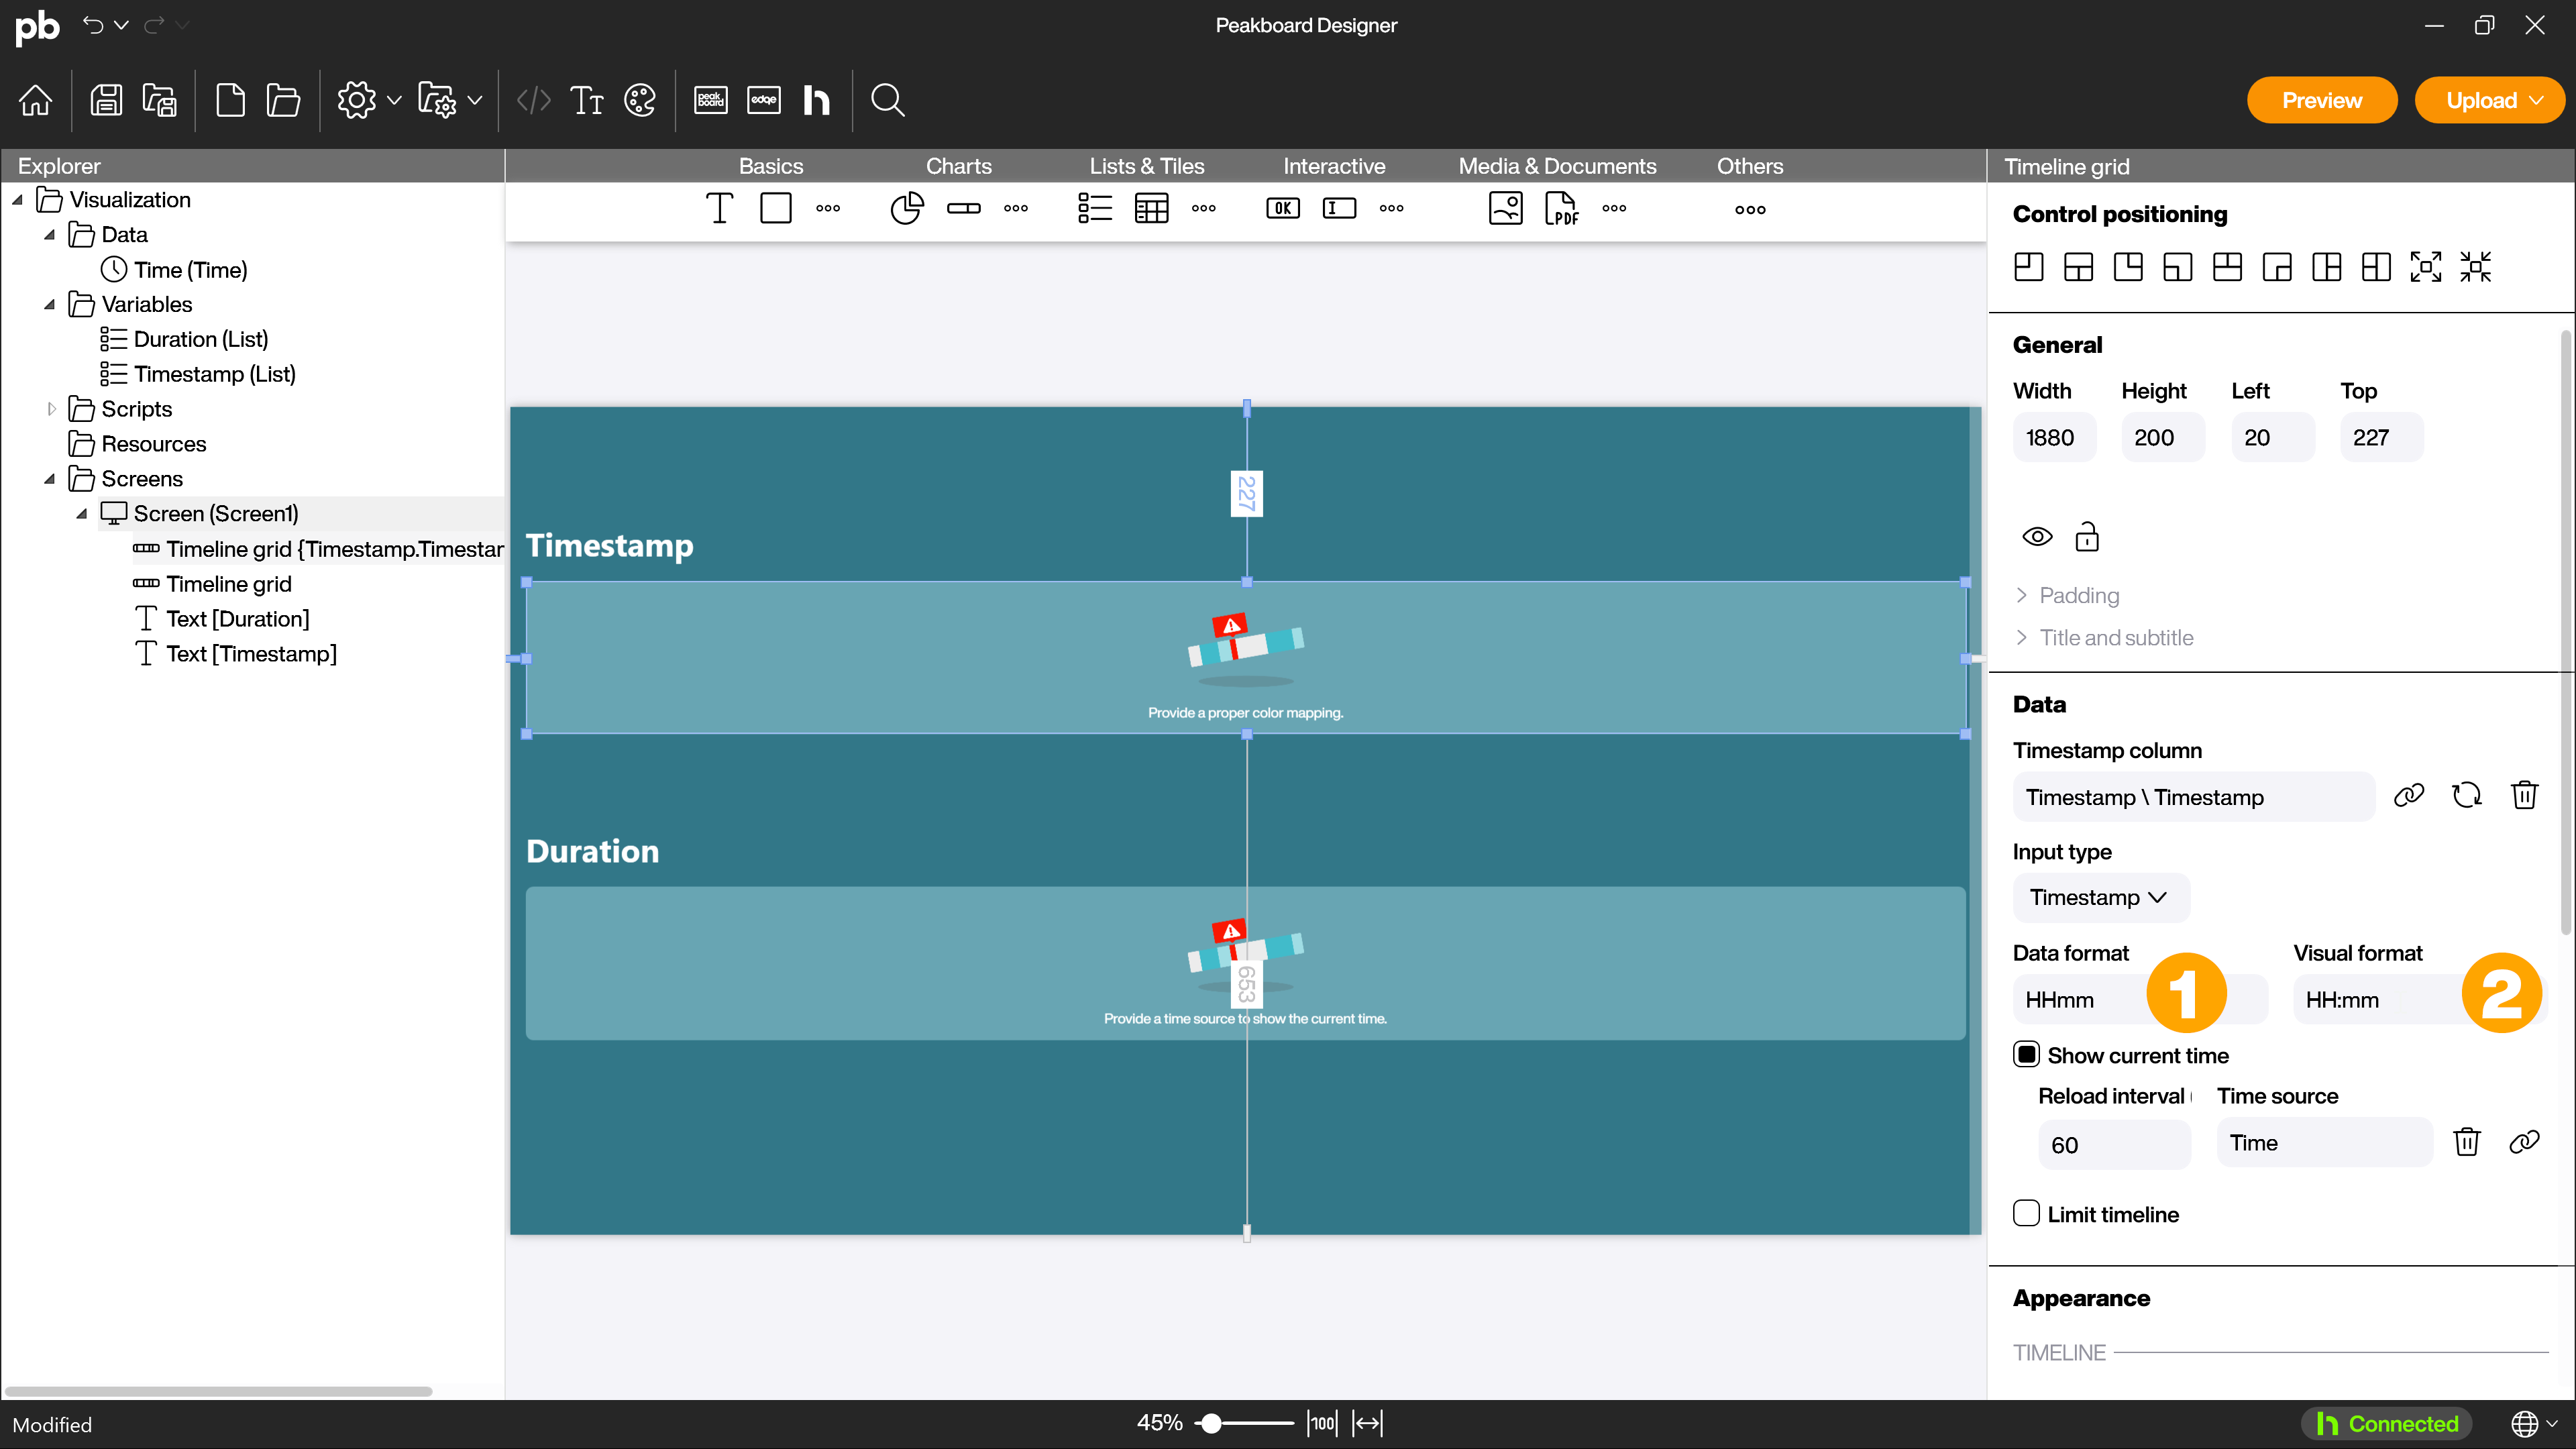
Now specify the format of the timestamps in the corresponding column of the data source in the [Data] section under [Data format] (1). Under [Visual format] (2), you specify the format in which the data is to be displayed later in the timeline grid.
Limit timeline
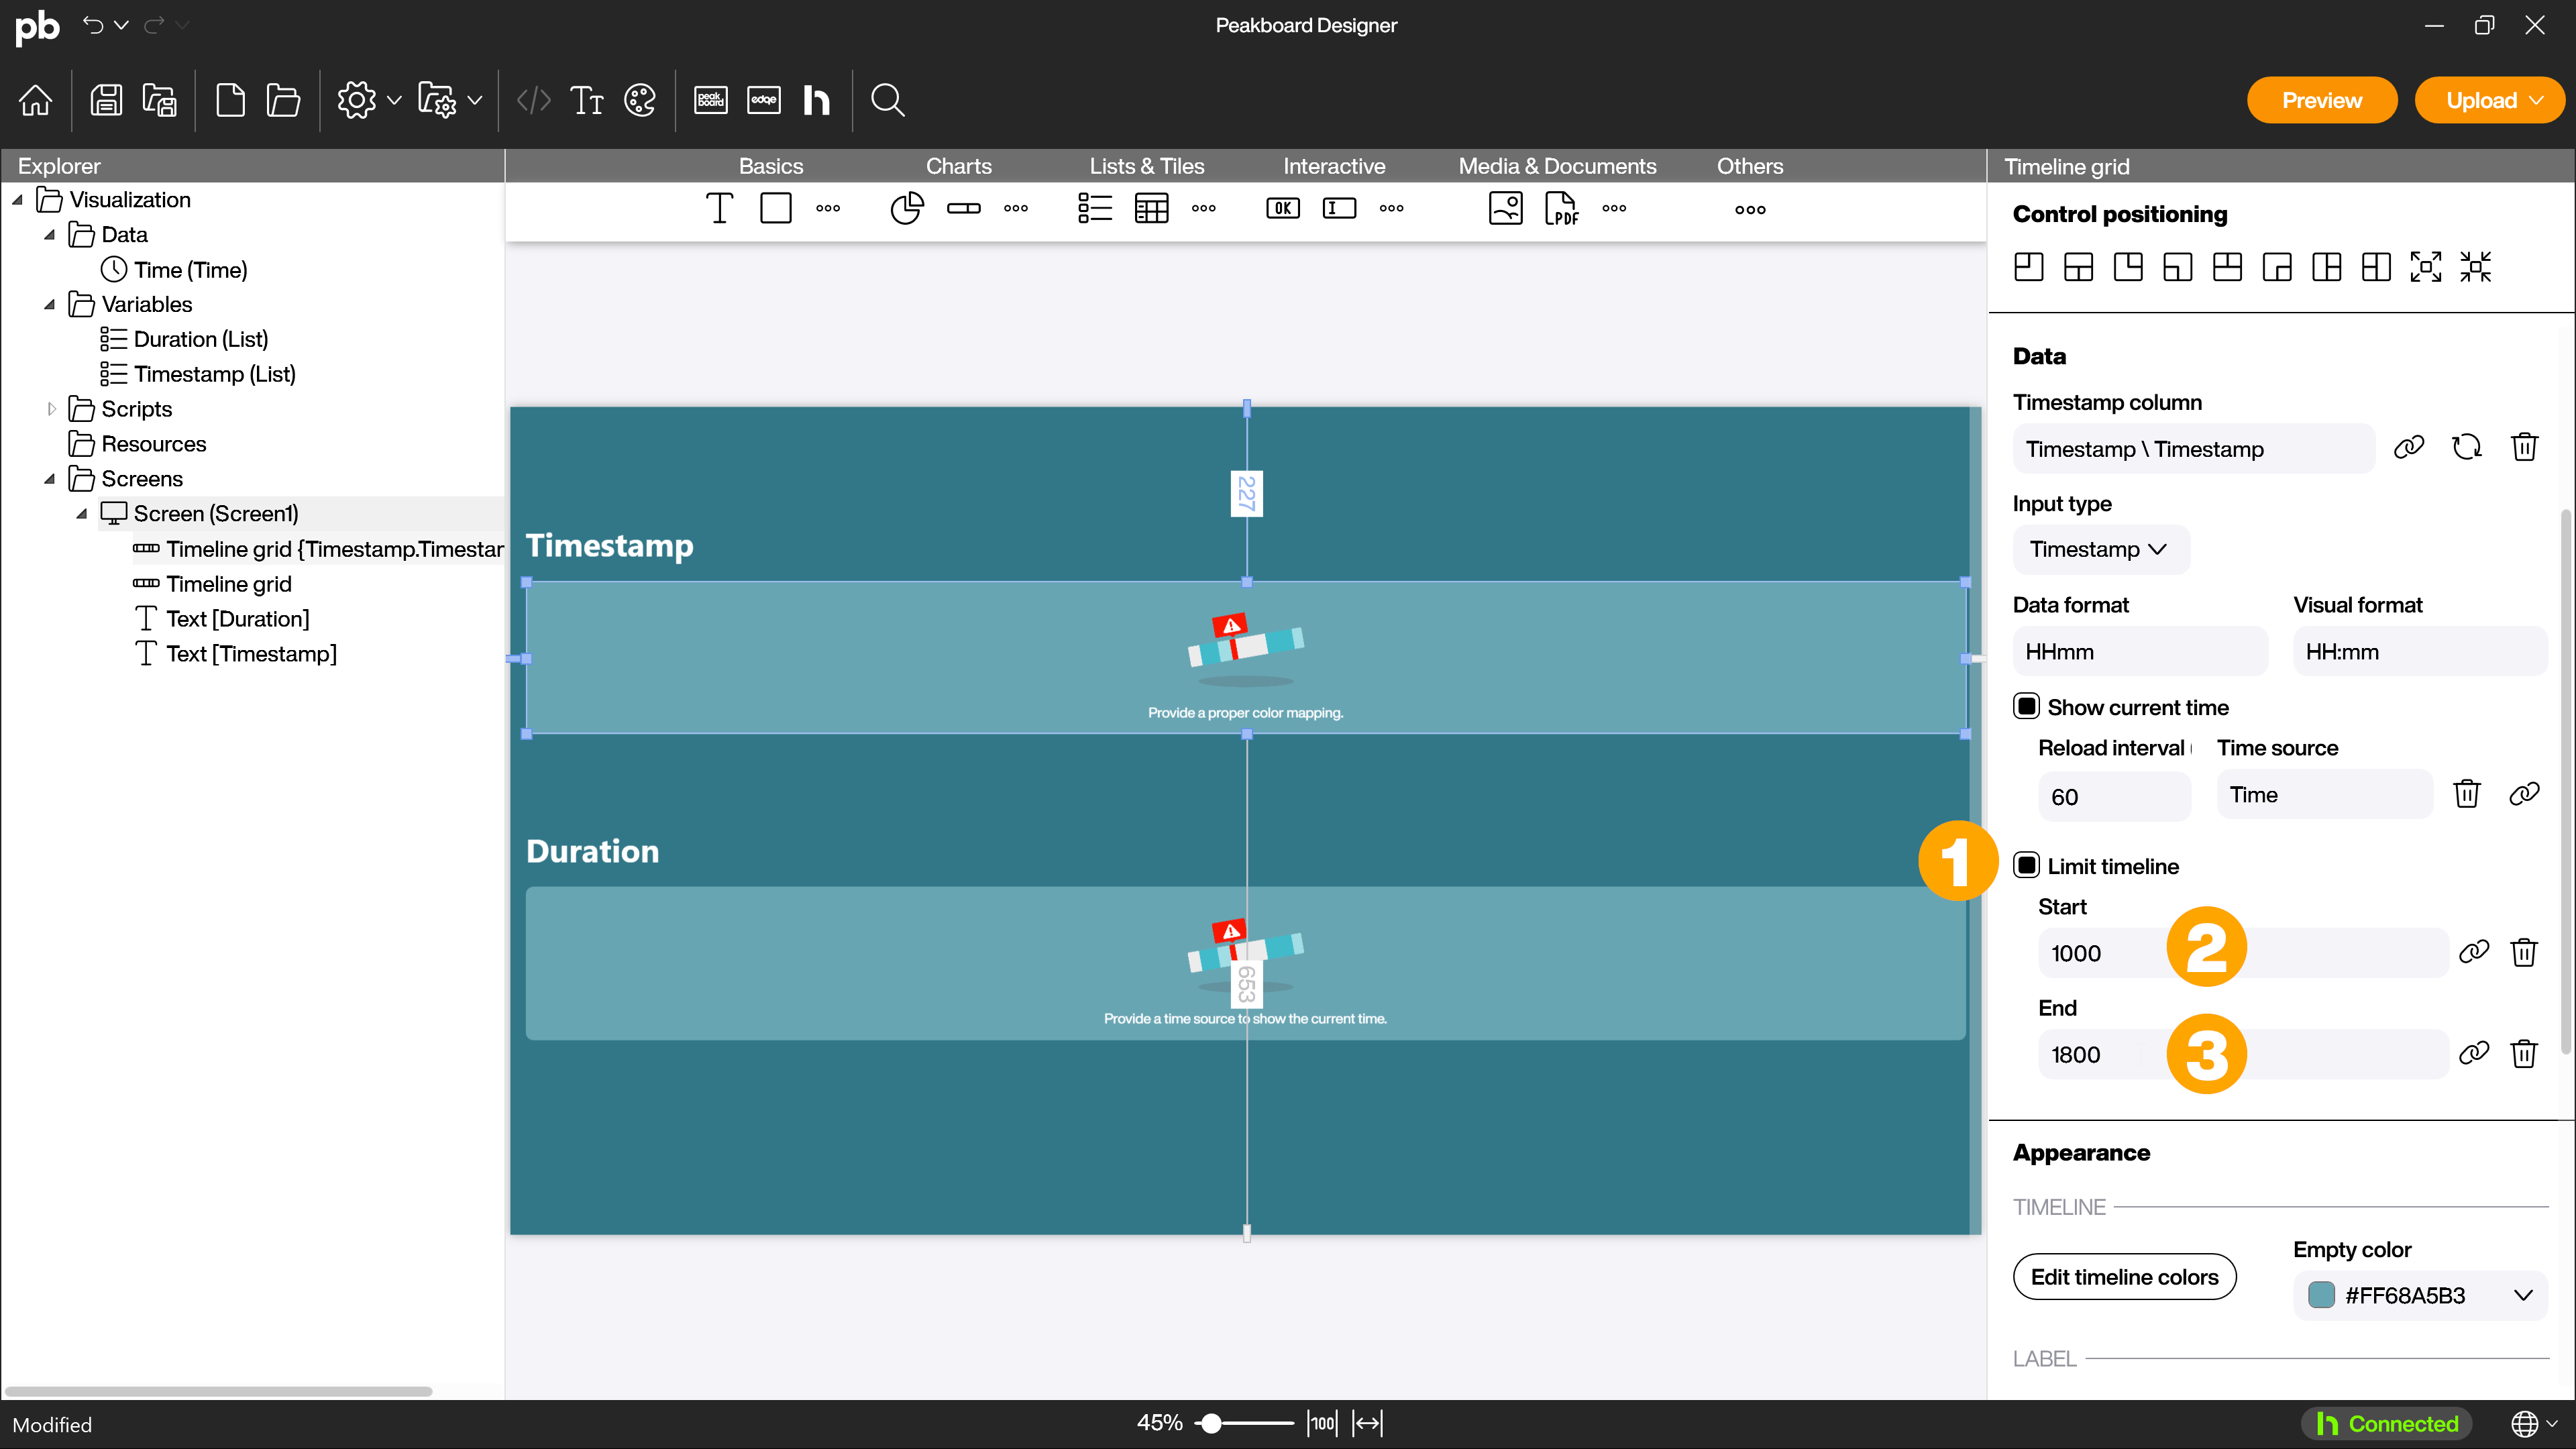
Now activate the option [Limit timeline] (1) and select [Start] (2) and [End] (3) of the time interval to be displayed. Make sure that this information is in the same format as the [Data format], in our case in the HHmm format.
Alternatively, for real use with a dynamic data source, you can also link a variable of the data type number with the start and end of the time interval.
Defining the appearance of the timeline grid
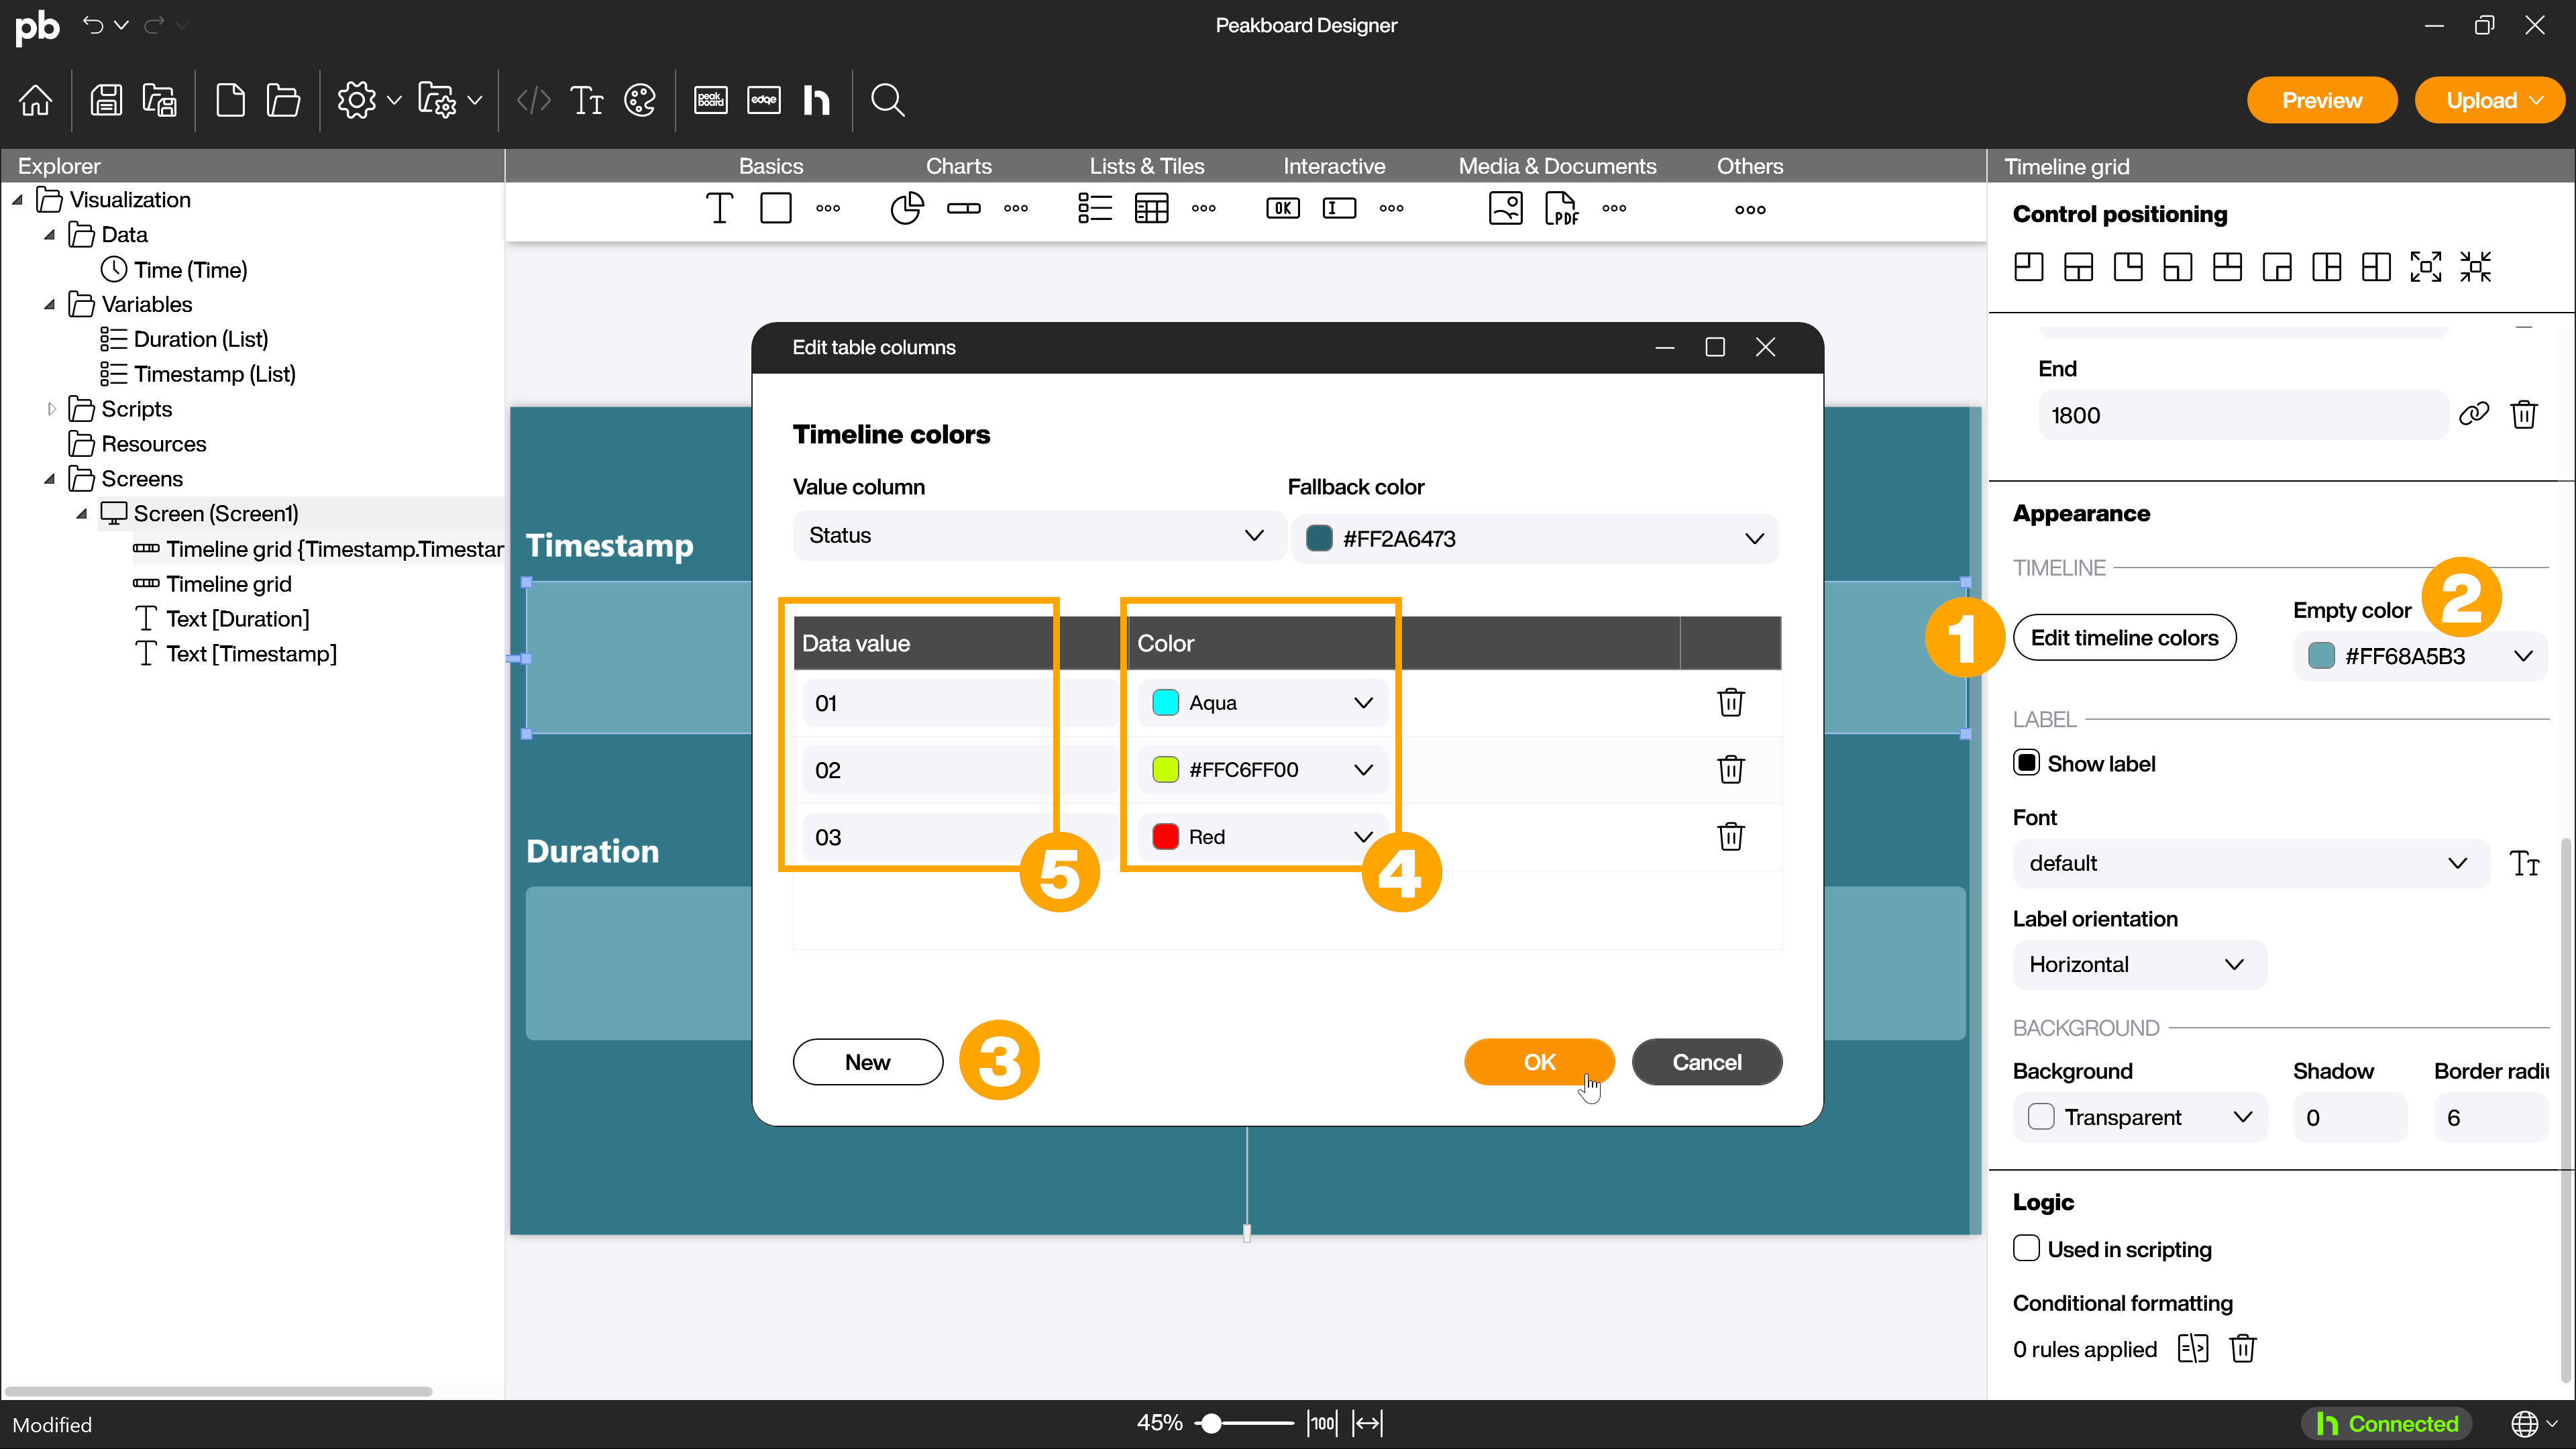
To display the different states, use the [Edit timeline colors] button (1) in the [Appearance] area to specify which color is assigned to the respective state. You can also define the [Empty color] (2) if this should not correspond to the default settings of the theme you are using.
To define your desired colors in the timeline colors dialog, click the [New] button (3) to create a new color (4) for each state and assign it to the corresponding state (5).
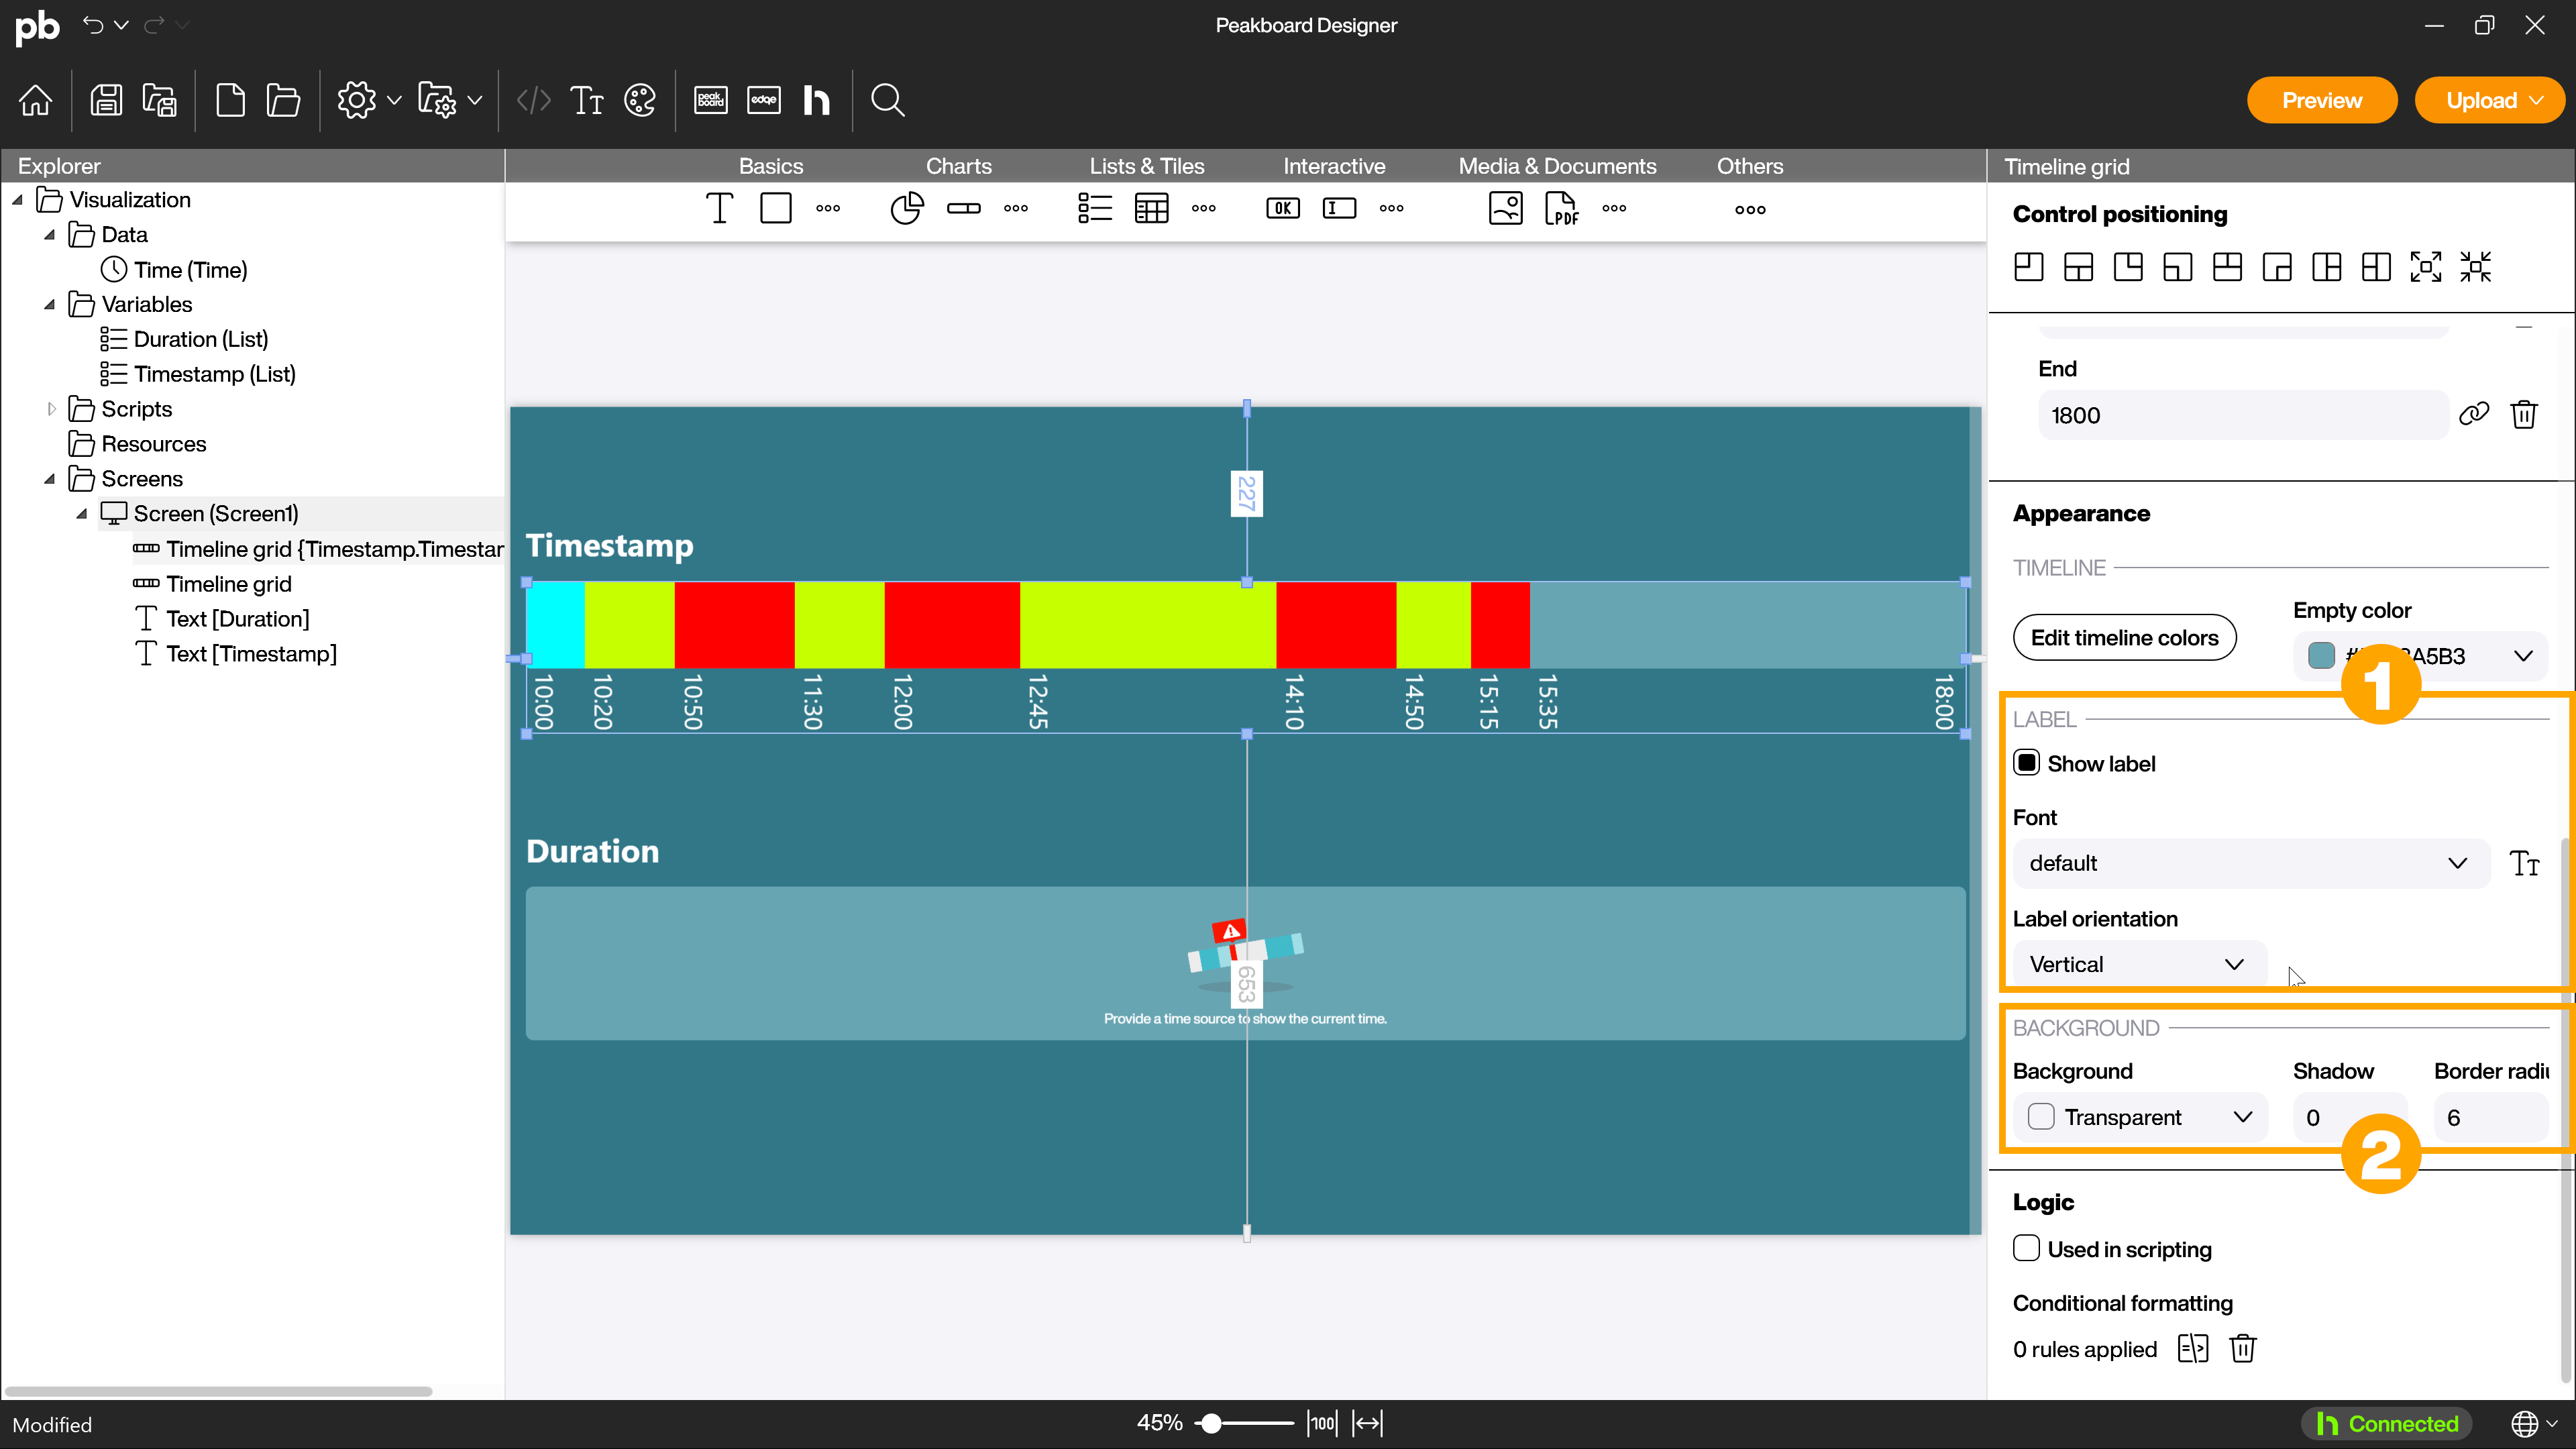
In addition to the timeline colors themselves, you can also specify how the labels should look in the [Label] (1) area and select visual options for the background in the [Background] (2) area.
Input type: Duration
The second option for displaying the timeline is the duration input type. To use this, you need a column in the data source that contains the duration of the respective state. This input type cannot be limited in the display, so all data recorded from the data source is shown in an overall display. The individual time periods are displayed in the time axis according to their share of the total duration of all time periods. In this way, the percentage ratios of the states over the total duration can be displayed visually.
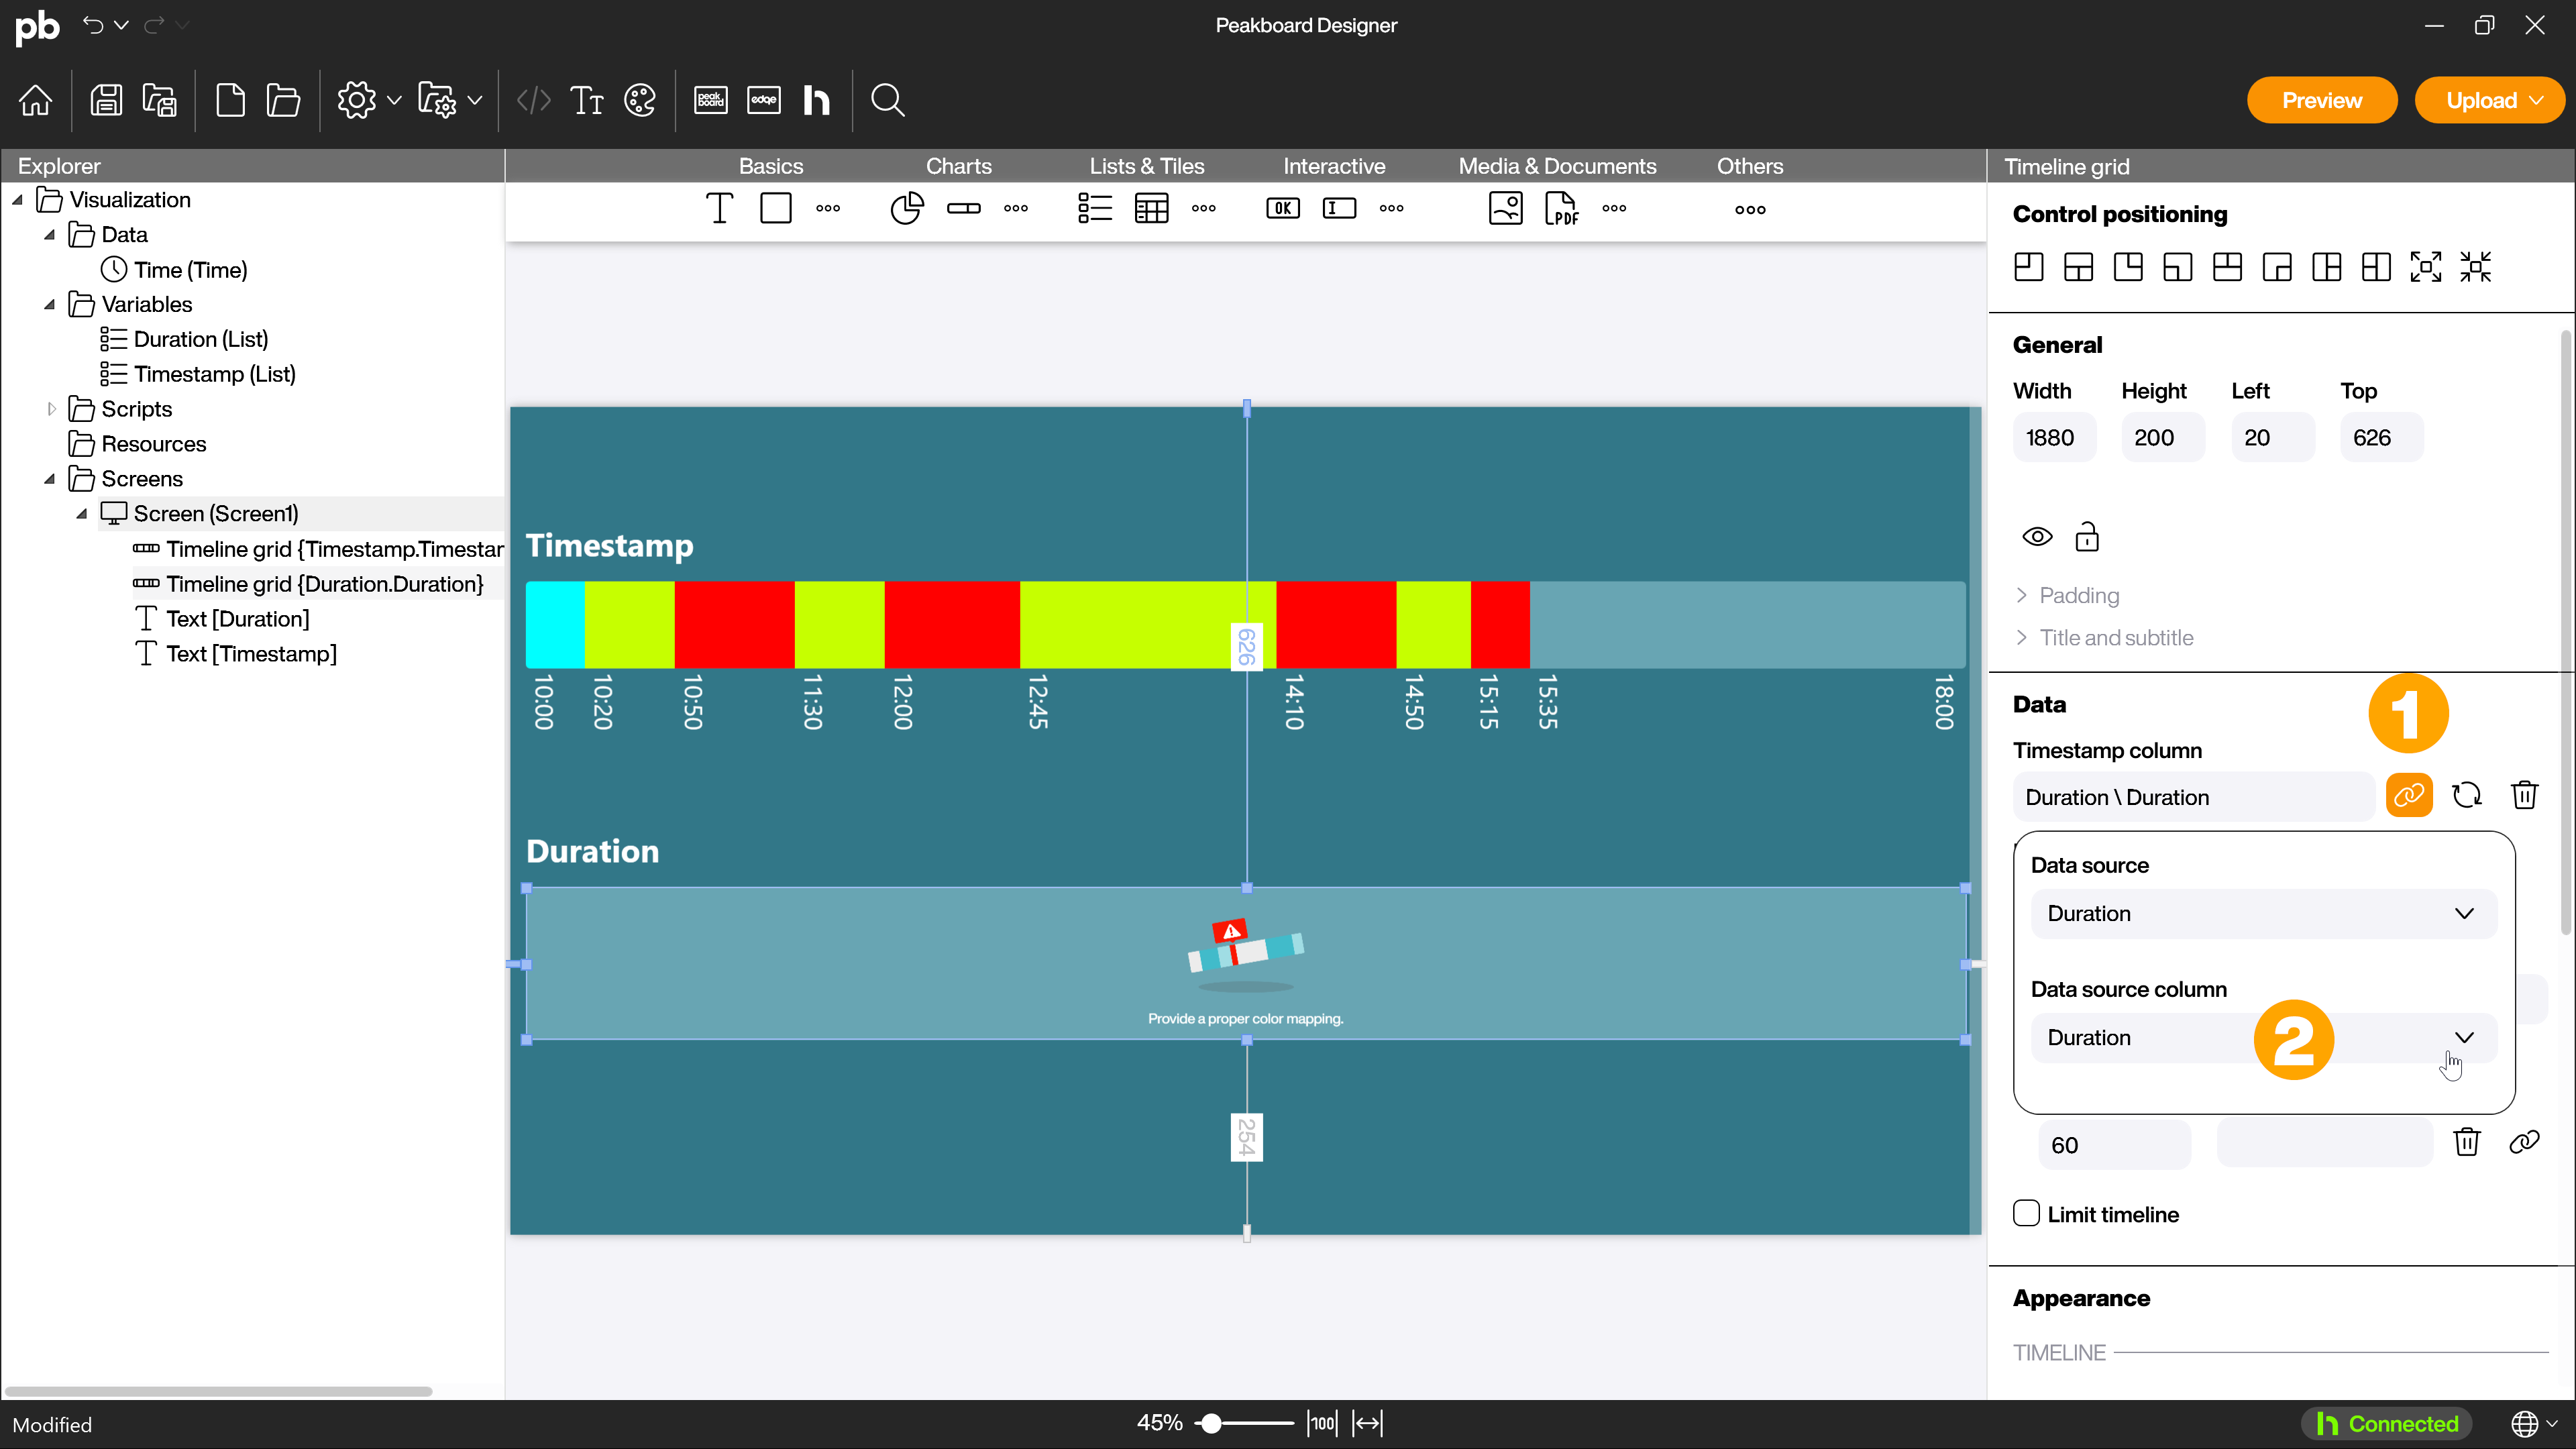
Use the link icon (1) in the [Data source] area to link the data source and select the column that contains the duration of the states (2).
Switch to the duration input type (1). Then select under [Label] (2) which column is to be used for labeling the states.
This completes the preparations for the duration input type.
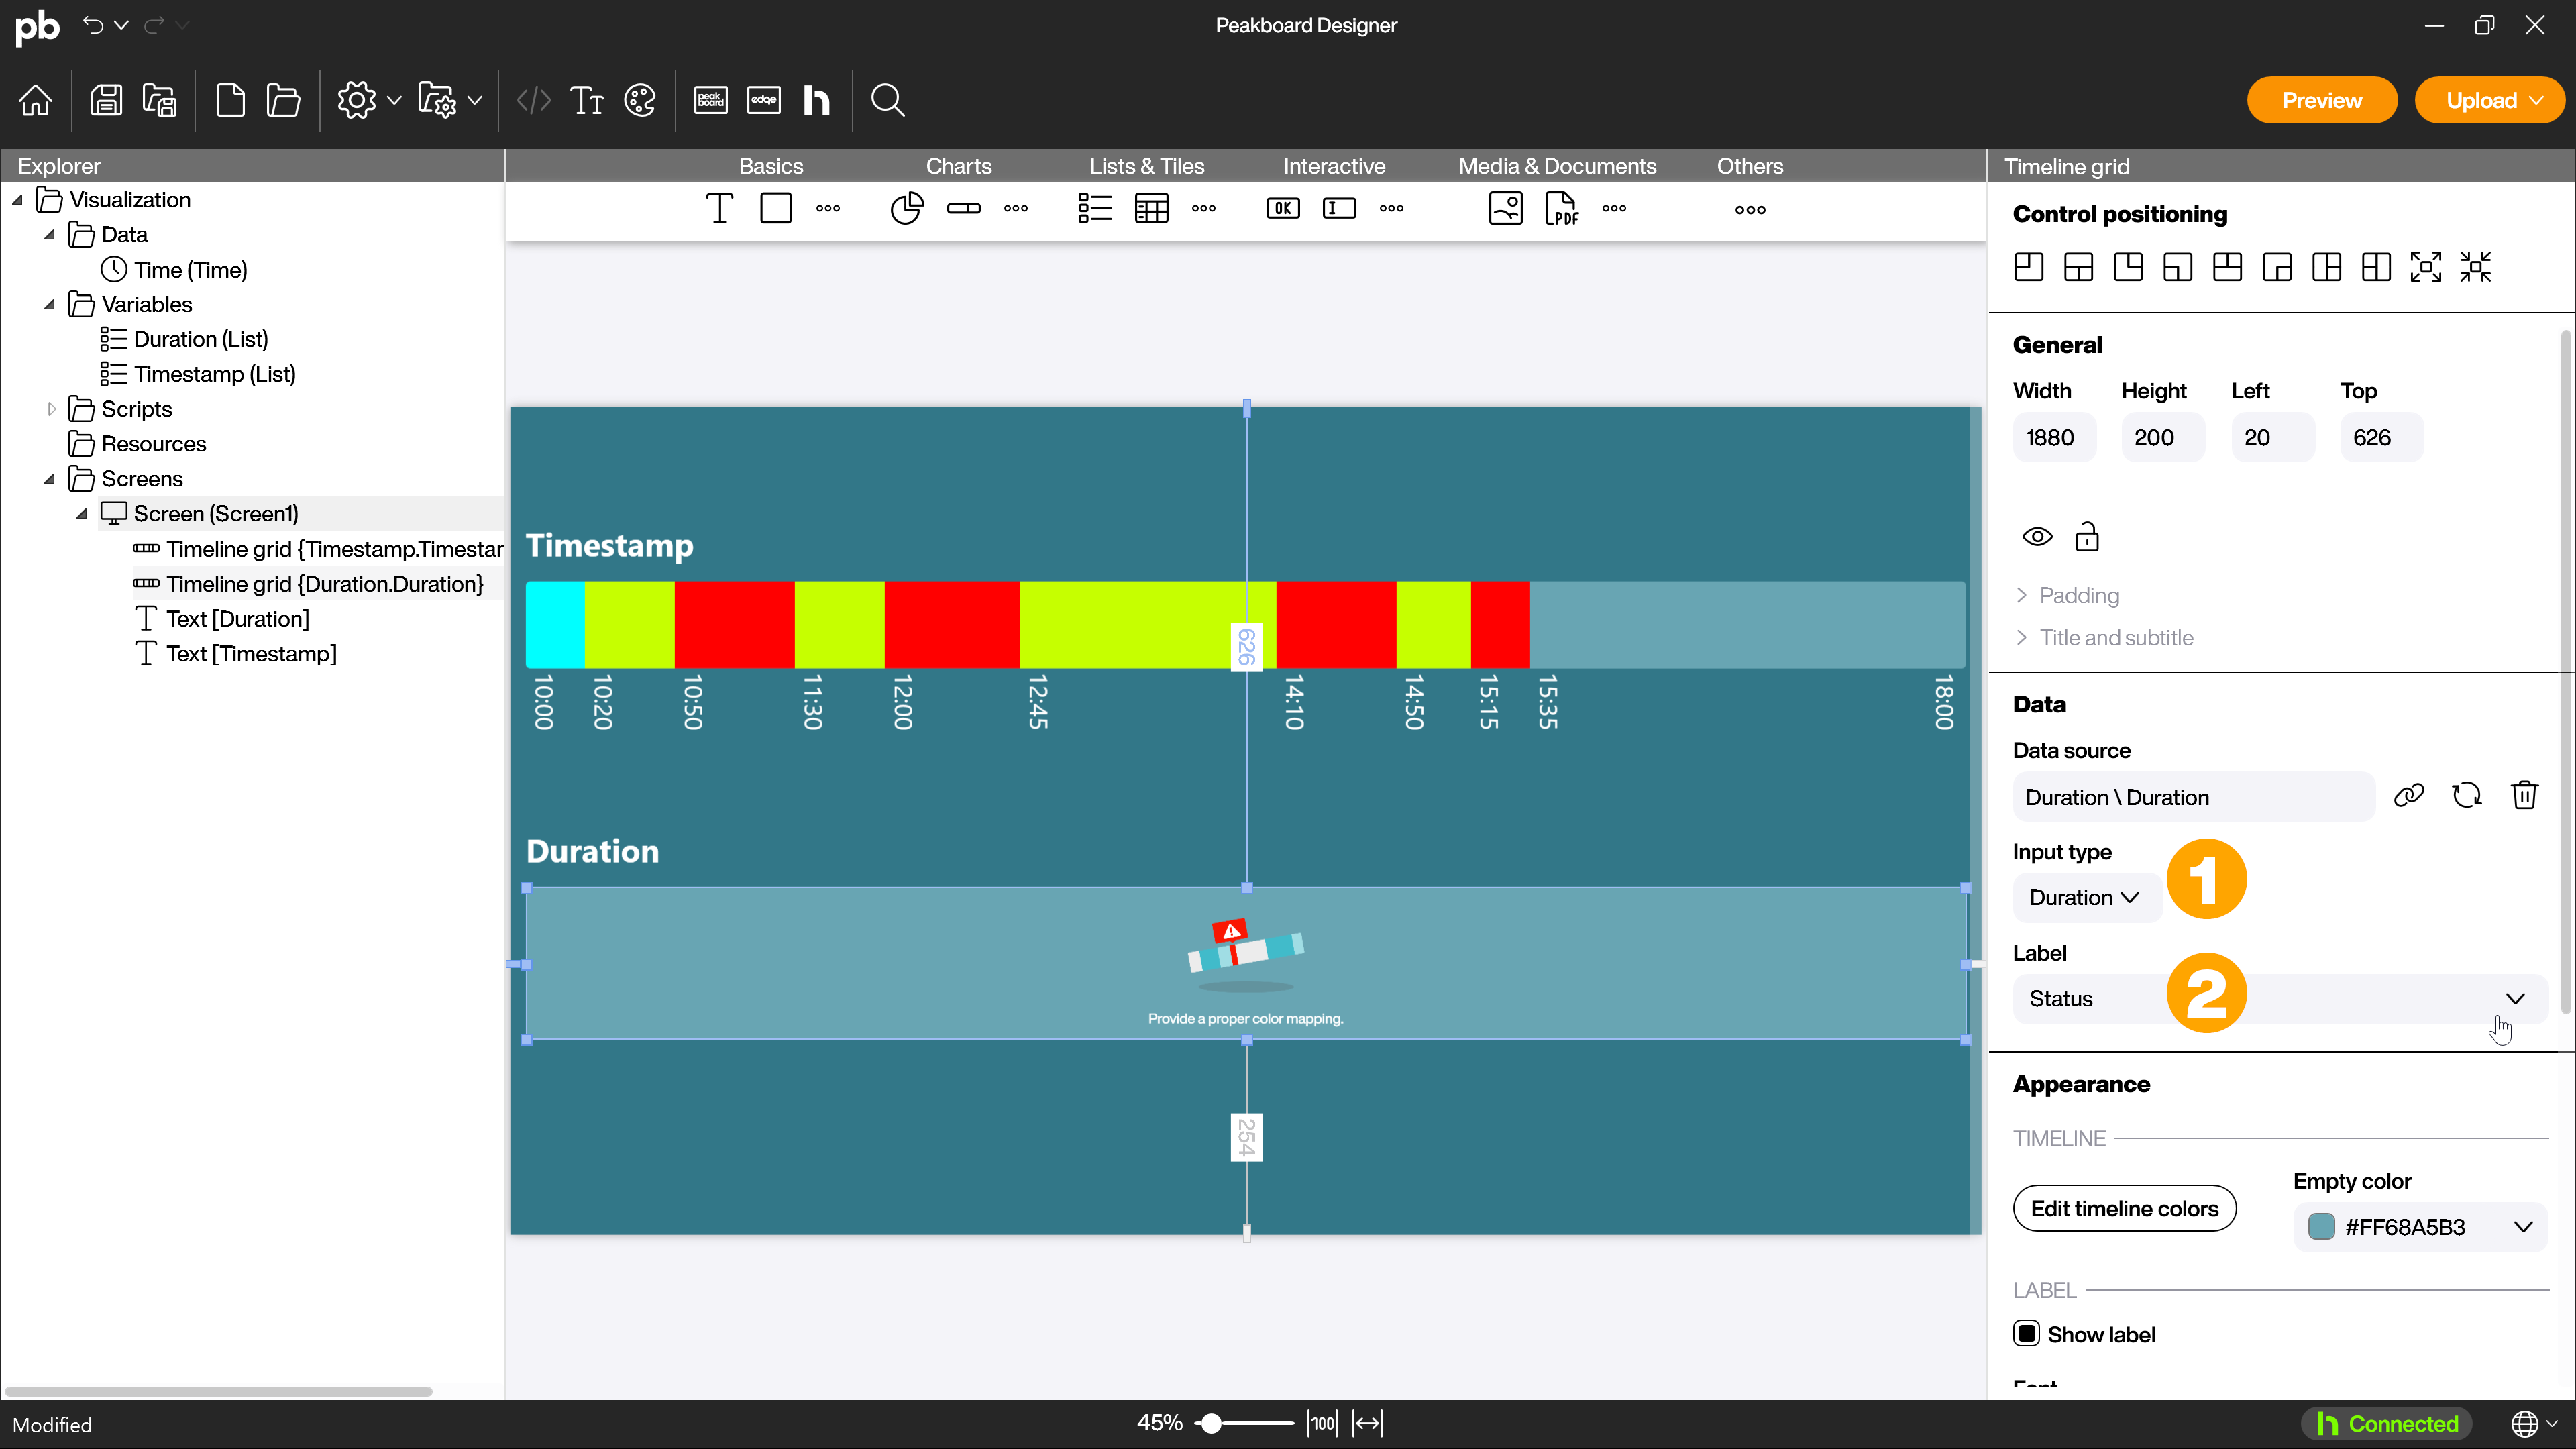
For the appearance of the timeline grid, proceed as described for the timestamp input type.
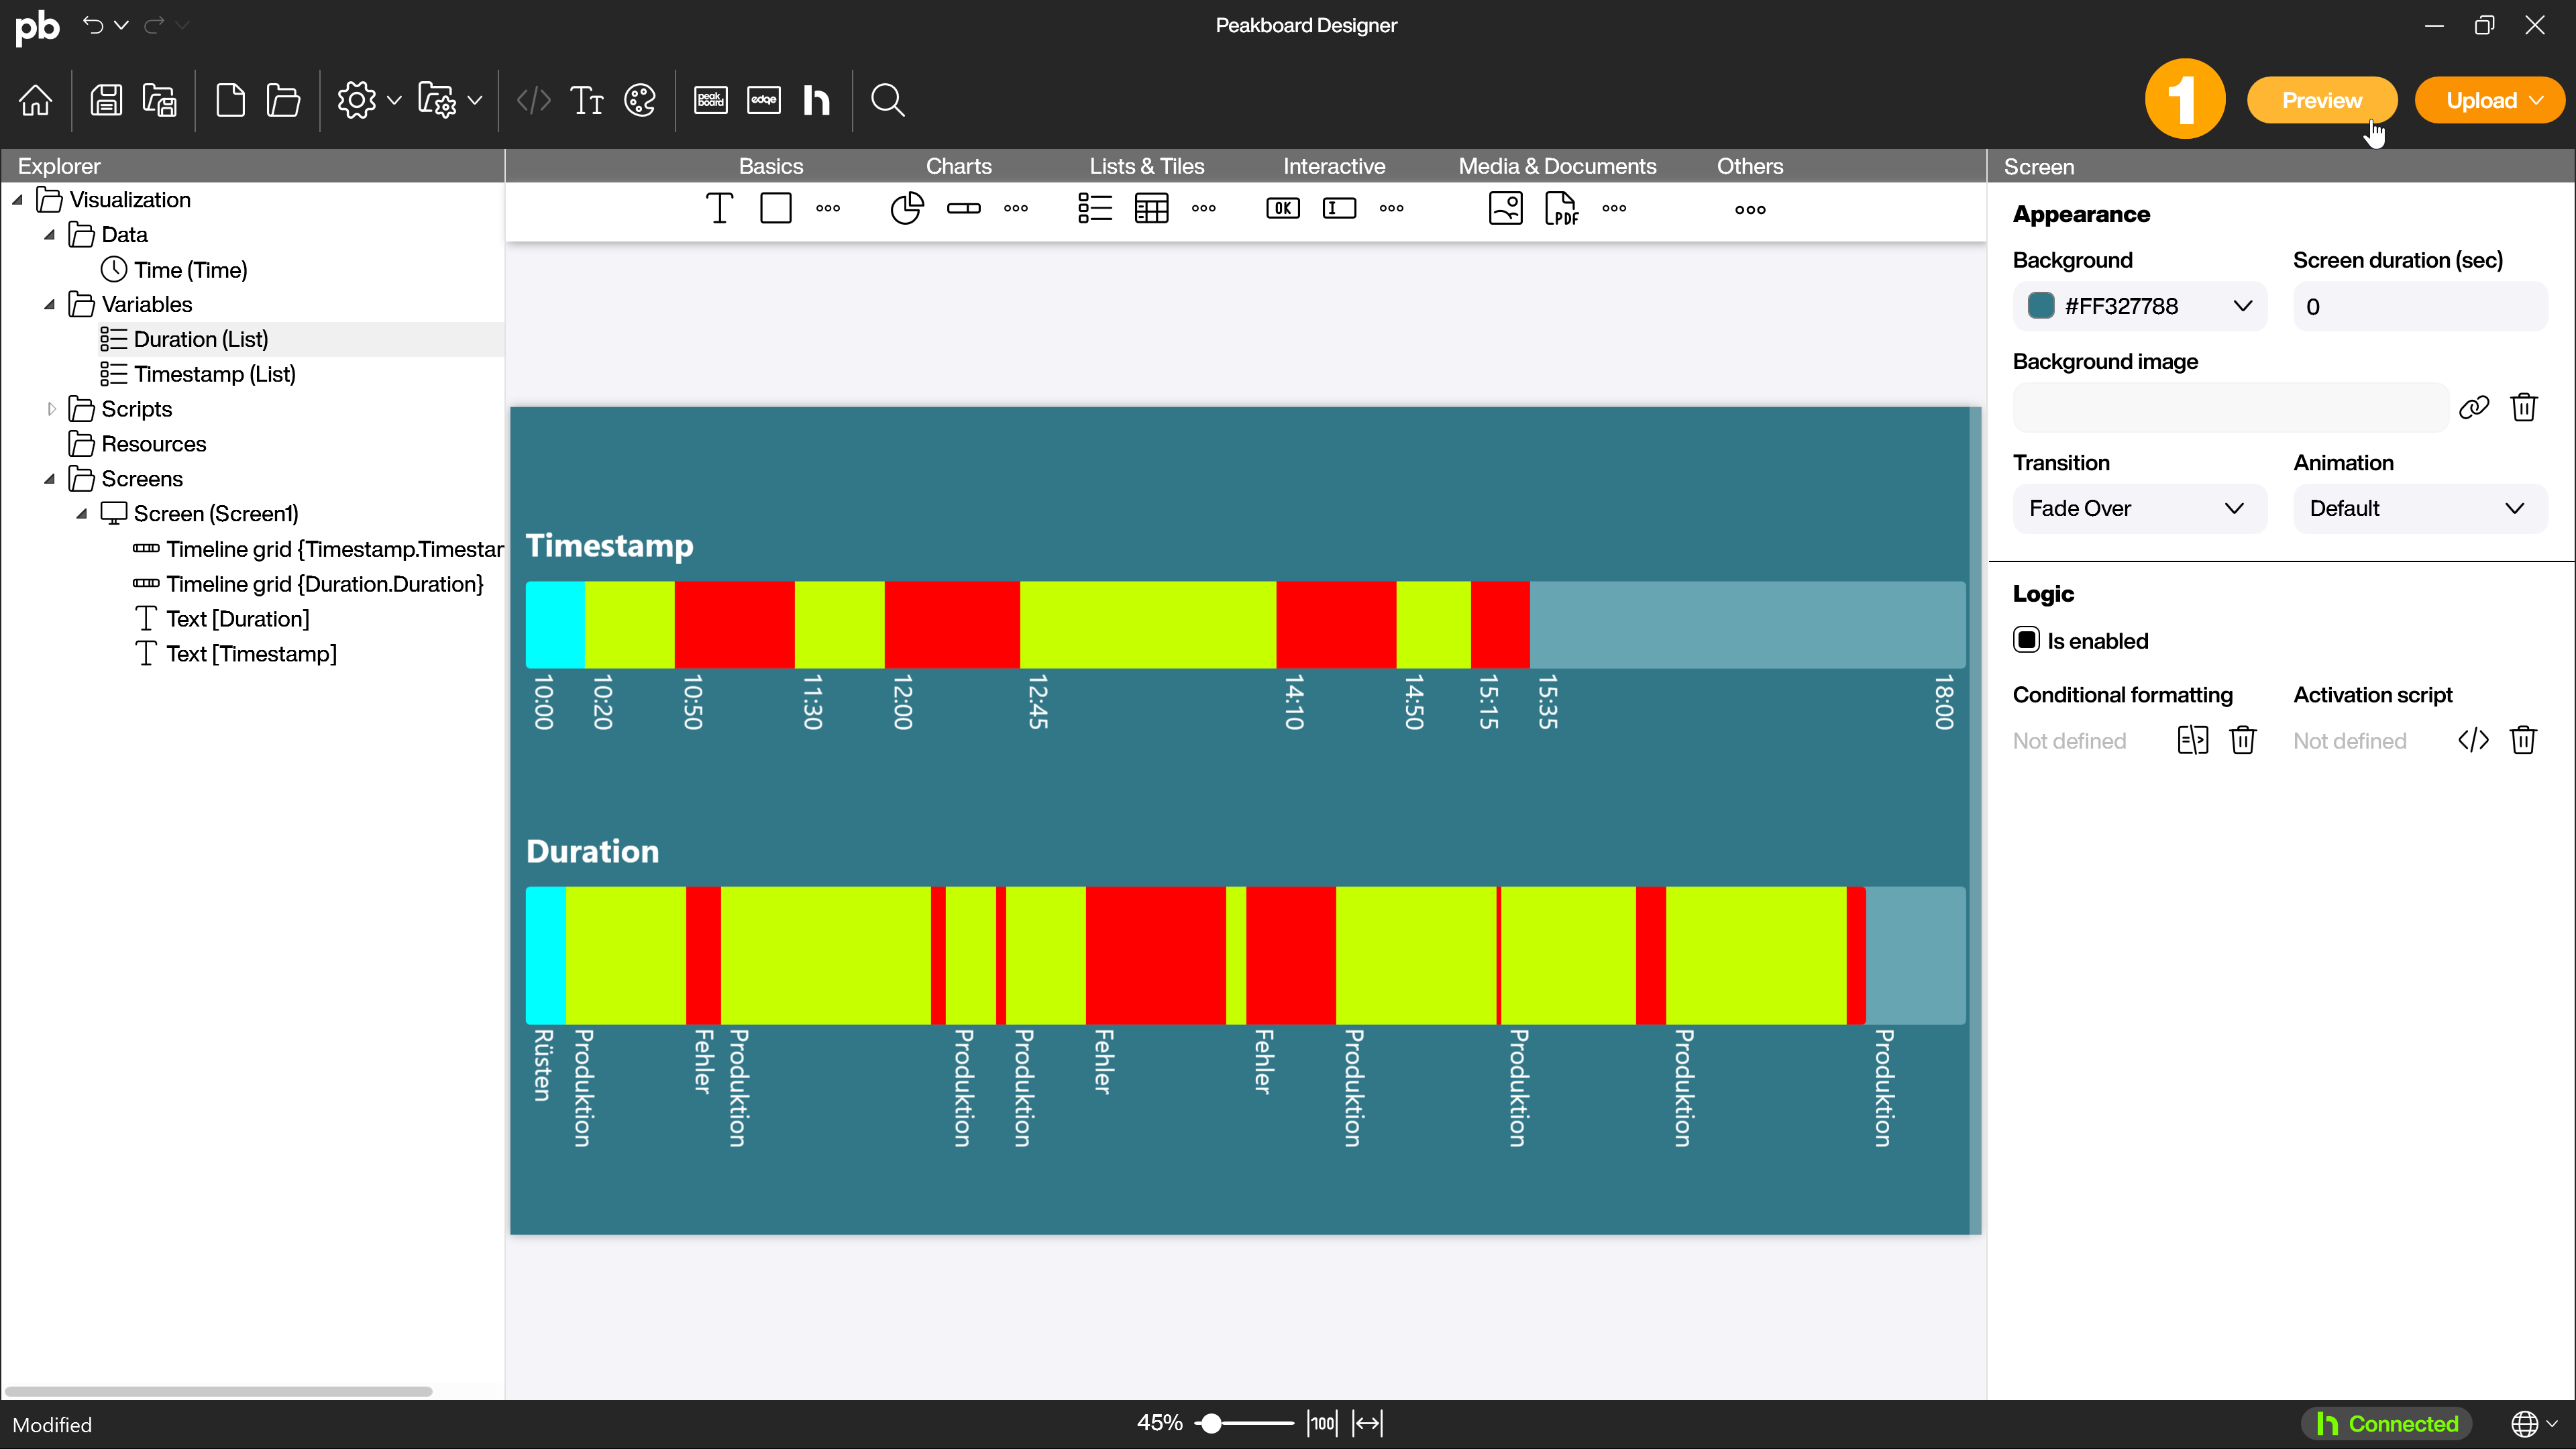
The finished timeline grids
You have now finished setting up the timeline grid and can test the display of the timeline grid using the [Preview] button (1). Depending on the selected data type and underlying data source, this may look differently.