Dataflows
Calculations
The category Calculations in the dataflow step selection holds the steps that condense and continuously calculate values: aggregate data or accumulate a column. To learn how to create a dataflow and add steps in general, see the first steps with dataflows.
Aggregate
With this step you aggregate the values of one or more columns. Aggregating data is a common use case in data preparation. A typical example is sales data with individual transactions. Most of the time you are interested in single, compressed numbers like the total sales over all transactions or the three customers with the highest sales.
For each aggregation, choose the mathematical function in the [Aggregation] field (1), the column it is applied to in the [Column] field (2), and enter a name for the result column under [New column name] (3). With the [+] button (4) you add another aggregation. With [Group aggregation] (5) you optionally select one or more columns to group the aggregation by identical values of these columns. If the data source contains a column with timestamps, enable [Time based aggregation] (6) and aggregate the data by a defined time interval.
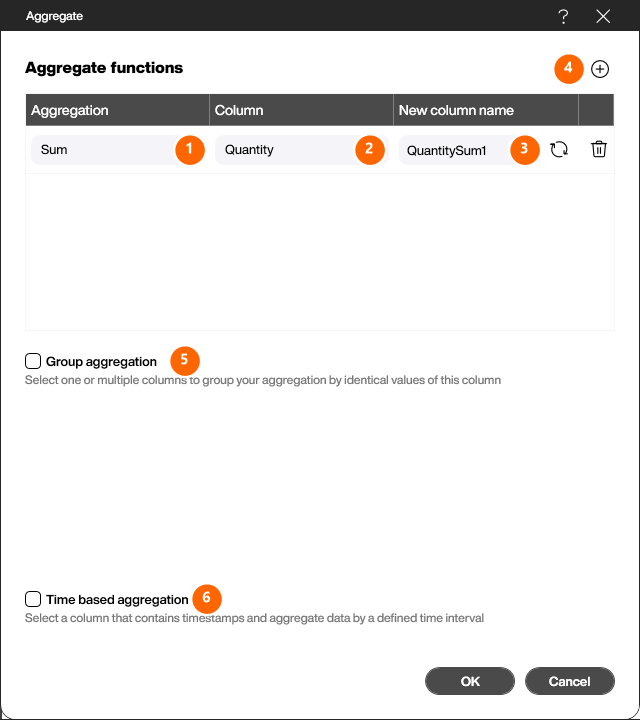
The following mathematical functions are possible:
- Min - returns the smallest value within the aggregation group
- Max - returns the largest value within the aggregation group
- Sum - sums all elements of the group
- Average - calculates the average
- Count - counts all rows in a group (and is independent of a specific numeric column)
- Distinct count - counts the distinct number of elements. For example, if there are customer numbers 4711, 4711, 4712, 4711, the distinct count returns 2 because there are two distinct customer numbers.
Accumulate
With this step you add a new column to the table with the accumulated (running total) values of a previously selected column. In the [Columns] field (1) pick the column to accumulate and enter a name for the result column under [New column name] (2). A requirement for this step are columns with the data type number.
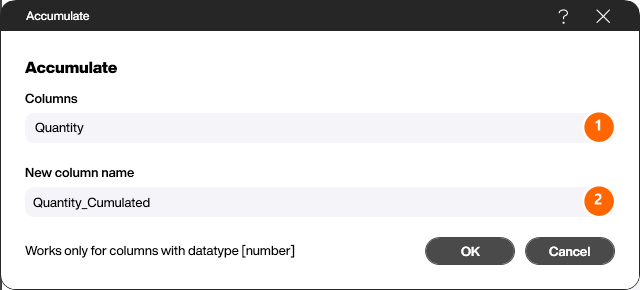
With the [Reference column] option you can accumulate separately for each group of rows that share the same value in that column — a running total per machine, for example. Without it, one running total is calculated across the whole table.
Duration
This step calculates how long each row lasted — the time from its own timestamp to the timestamp of the following row. It is the usual way to turn a log of status changes into a table of durations, for example to find out how long a machine stood still.
Select the column holding the timestamps under [Timestamp column] and, if the values are not recognised automatically, specify how they are written under [Input format]. Under [New column name] you give the calculated column a name.
Two options refine the calculation:
- Reference column: measures the duration separately within each group of rows that share the same value in this column — for example per machine. Without it, the whole table is treated as one sequence.
- Open duration up to now: the last row of a group has no successor, so its duration would stay empty. Enable this option and pick a time data source, and the duration of that row is measured up to the current time instead. That is what keeps a still-running state visible on a dashboard.
The duration is always measured from one row to the next, so the rows have to be sorted by timestamp. If they are not, the Peakboard Designer warns you and suggests adding a sort step before this one.