Data sources
Peakboard Data Source
The Peakboard data source provides an easy way to share data between several Peakboard Boxes. It lets you read and write the native variables and lists of one box from other Peakboard Boxes within the same network – without any custom scripting. One box exposes its data through the built-in API (the provider), and another box consumes it through the Peakboard data source (the consumer).
Reading from another box
In this scenario the visualization running on the consumer box accesses the data on the provider box for reading. It is important to understand the role of the two boxes.
Provider box: expose the data via the API
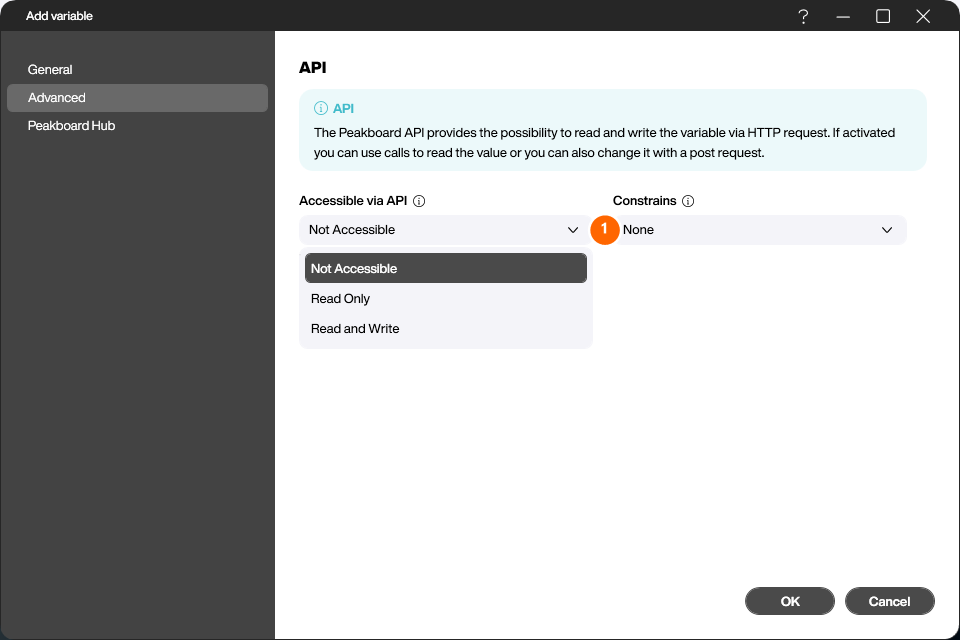
Since the Peakboard data source is meant for direct communication between two Peakboard Boxes, it can only access native Peakboard variables and lists. To expose a variable, open it in the explorer, switch to the [Advanced] section and set the [Accessible via API] option (1) in the [API] area:
- Not Accessible – the variable cannot be reached through the API.
- Read Only – other boxes may only read the value.
- Read and Write – other boxes may read and write the value.
[Read Only] is enough for the reading scenario; for the writing scenario described below, choose [Read and Write].
Native lists are exposed the same way: open the list, switch to its [Advanced] section and set the API access level there.
Consumer box: add the Peakboard data source
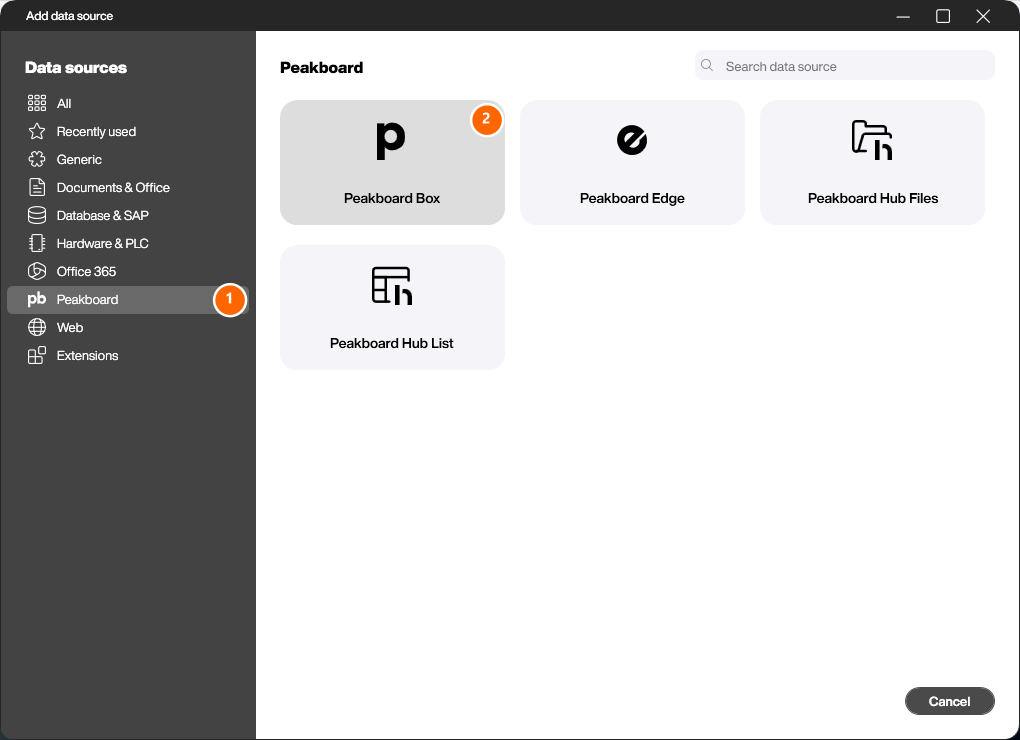
On the consumer side, the Peakboard data source is a wrapper around this API that makes reading – and potentially writing – the data as easy as possible. To create a Peakboard data source, click [Add Data Source] in the [Data] section of the explorer. Select the [Peakboard] category (1) and then the [Peakboard Box] data source (2).
Configure the data source
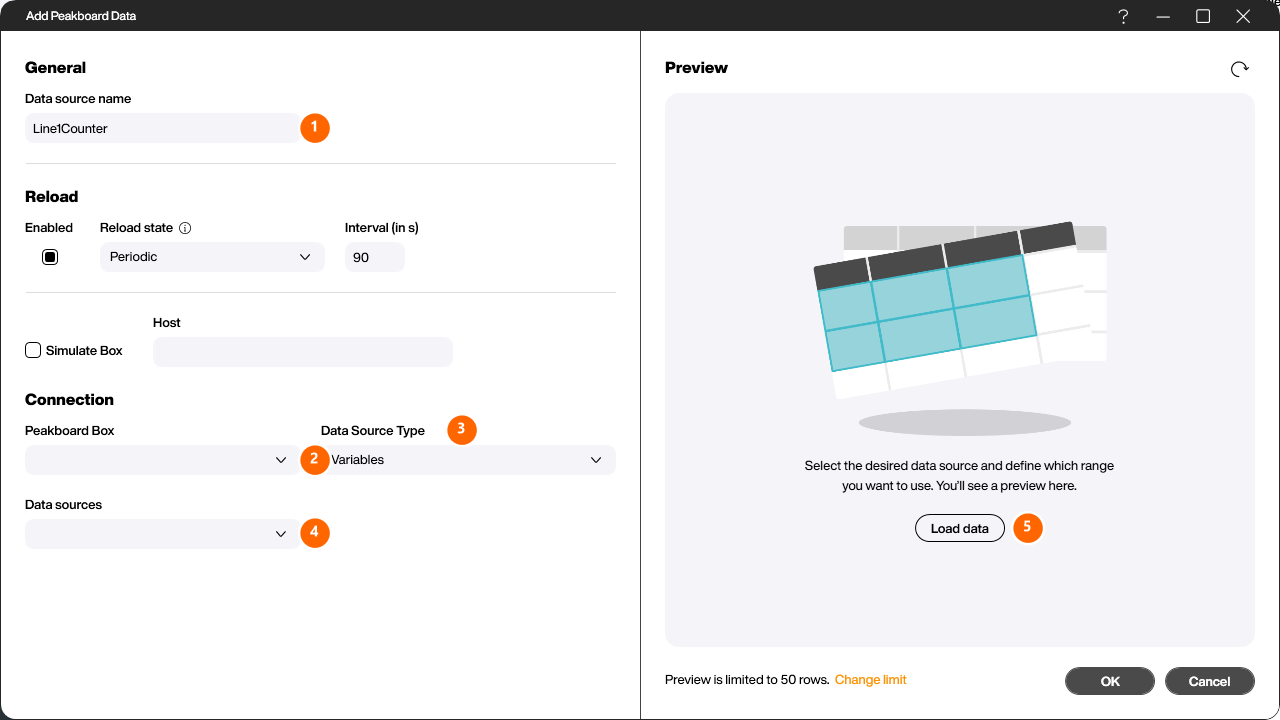
In the [Add Peakboard Data] dialog you set up the connection:
- Enter a unique name for the data source in the [Data source name] field (1).
- Under [Peakboard Box] (2), select the box you want to query. The list of boxes is taken from the management dialog ([Manage]). If your box does not show up in the drop-down, make sure it was added there.
- Use [Data Source Type] (3) to define whether you query a list or scalar variables.
- Under [Data sources] (4), pick the actual list or the variables you want to request.
- Click [Load data] (5) to send a request for the current configuration and see a preview of the data.
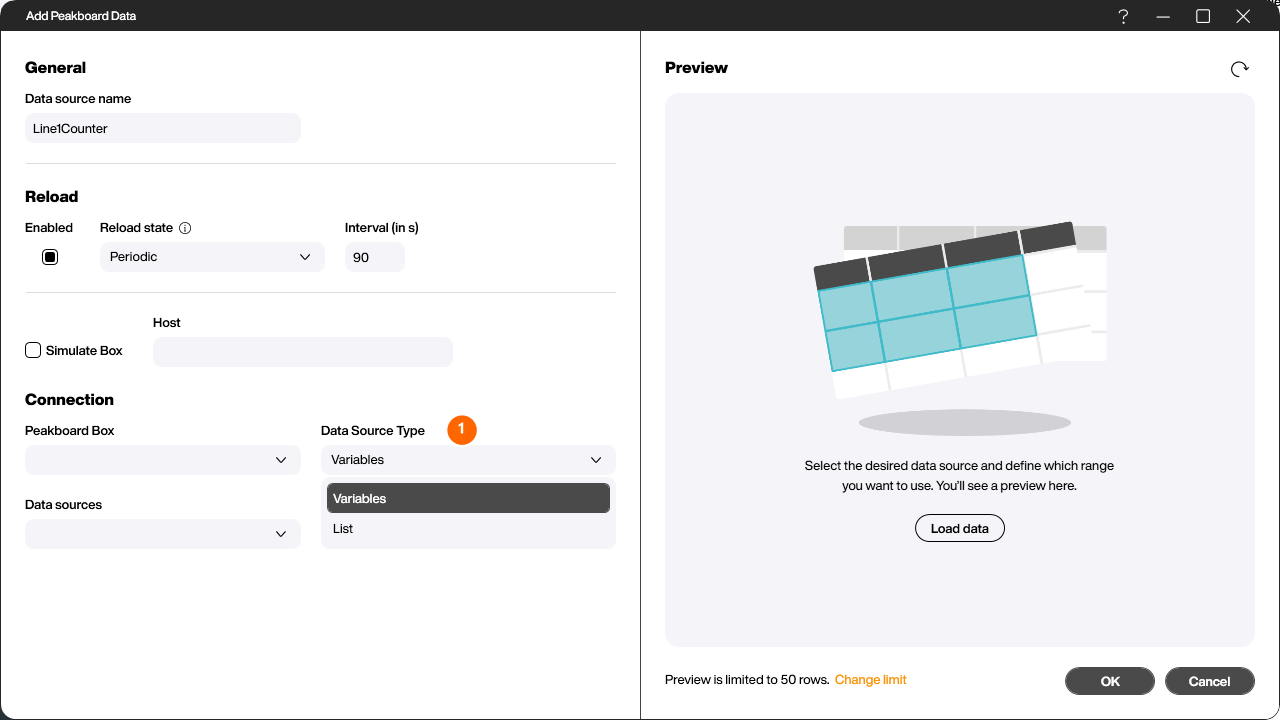
A Peakboard data source always delivers its data as a table – no matter whether a list with hundreds of rows is consumed or only a single variable is queried. The [Data Source Type] (1) decides between the two variants:
- Variables – an arbitrary number of scalar variables (at least one), presented in a table with a single row.
- List – exactly one native Peakboard list.
Optionally you can define an automatic refresh interval in the [Reload] area, and use [Simulate Box] to simulate a box when no real one is available yet. After saving with [OK], the data source and its data can be used like any other.
Writing to another box
To write data to another Peakboard Box, the Lua scripting engine is used. The Peakboard data source provides functions that let you run instructions on the lists and variables defined in the data source. These instructions also provide a certain level of safety for the data travelling over the network.
Imagine the following scenario: In a production hall there are three production lines. Each of them is connected to a Peakboard Box that shows the current number of pieces manufactured during the running shift. A fourth master box should gather this information and be able to reset the counts. Implementing this used to be quite tedious, because it required a lot of scripting to build the requests that set the data on the individual boxes.
Say the variables holding the piece count are called line1qnty, line2qnty and line3qnty. The master box gets its own Peakboard data source for each of these boxes, built as described above. It queries the values automatically and makes them available in the visualization like any other data source.
The data sources expose various functions through the scripting API. Resetting a value, for example, is done by calling:
data.datasource.value.set(0)
A list-based Peakboard data source exposes the following functions:
append(item)remove(index)insert(index, item)set(index, item)clear()
A scalar-based Peakboard data source exposes the following function:
set(value)
Depending on the data type, these additional functions are supported:
For numbers:
add(value)subtract(value)multiply(value)divide(value)power(value)
For strings:
append(string)
Note that mixing operations may have unforeseeable effects when they are executed from several boxes at the same time. If, for example, the operations add(2) and multiply(2) arrive at the same time, the visualization cannot know which one should be executed first. Subtractions and additions, in contrast, can be executed in any order.