Controls
Excel chart
The Peakboard Designer offers you numerous options for integrating and visualizing your data in your application with charts, gauges, the signal lamp and the timeline grid. However, in some cases it may make sense to import the entire visualization instead of just the data. This is exactly what the Excel chart control offers. With this control, you can integrate an existing chart from an Excel file into your application.
**Attention!
Make sure you check in advance whether it really makes sense to use Excel as a chart generator! A technically better alternative is to import the raw data and use the possibilities of the Peakboard Designer for the visualization.
Add Excel chart
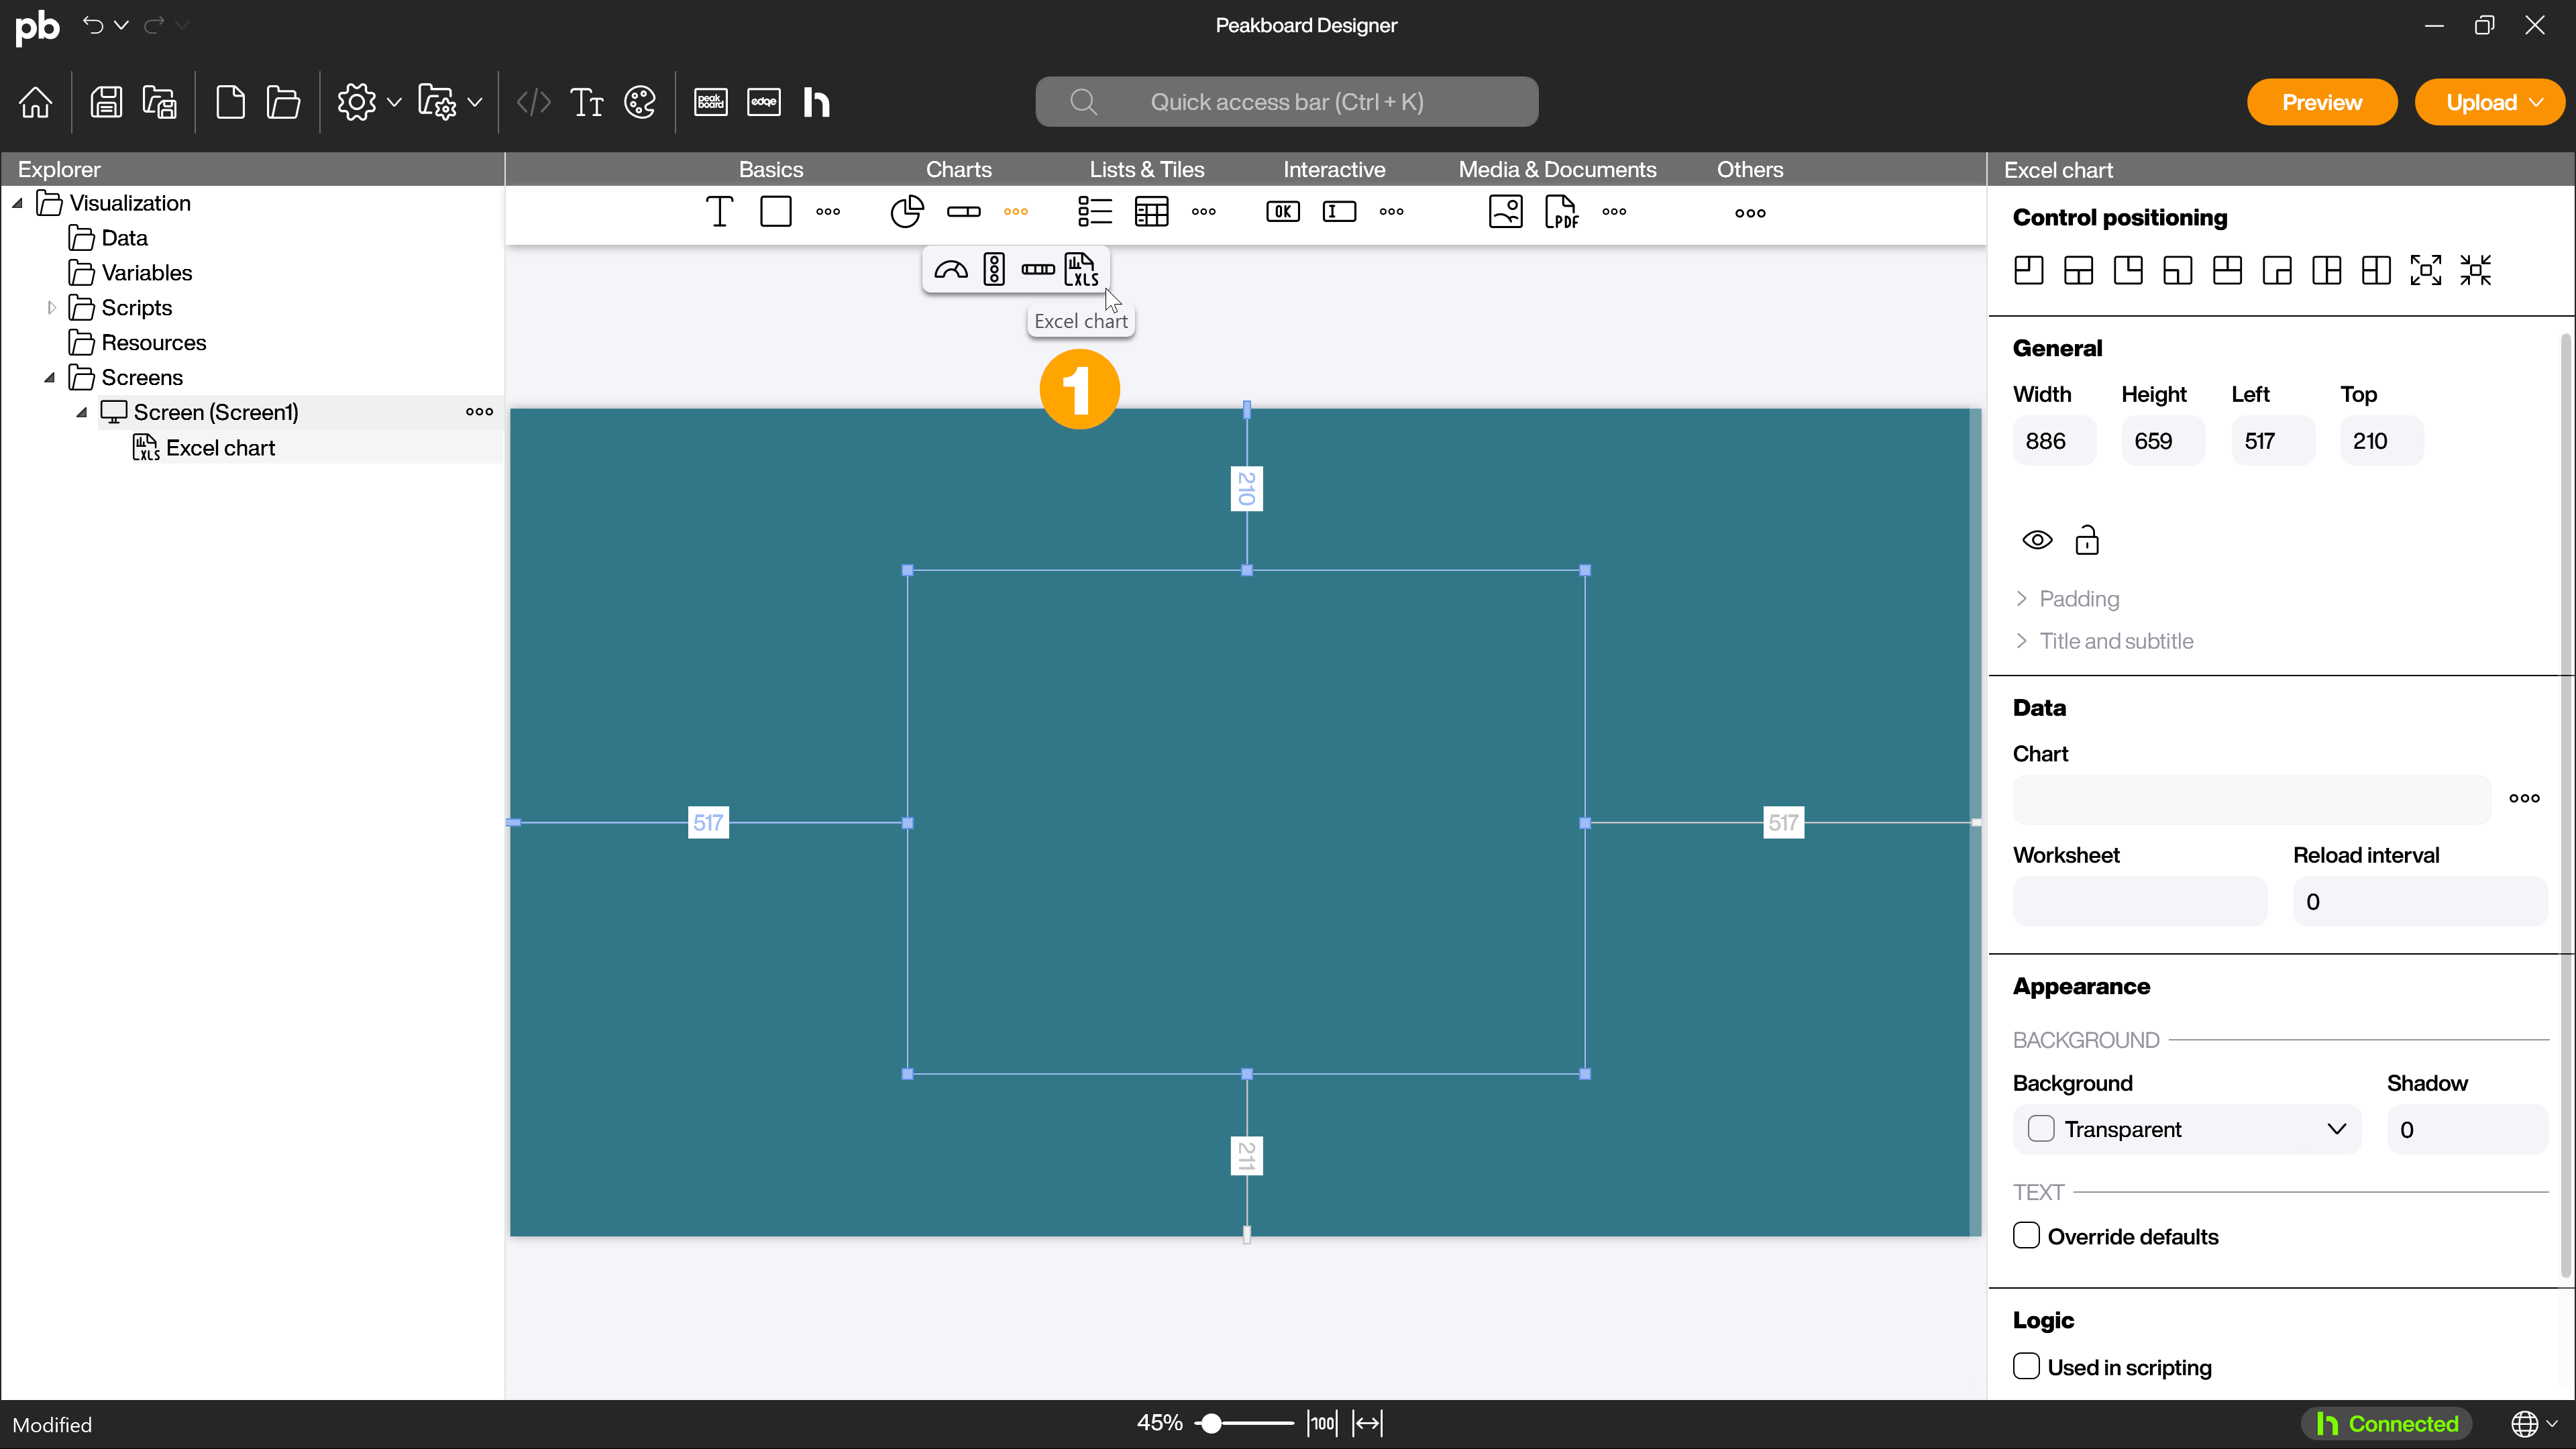
Drag and drop the control (1) onto the workspace and roughly position and scale it. Then double-click on the empty control to open the configuration dialog.
Connect Excel resource
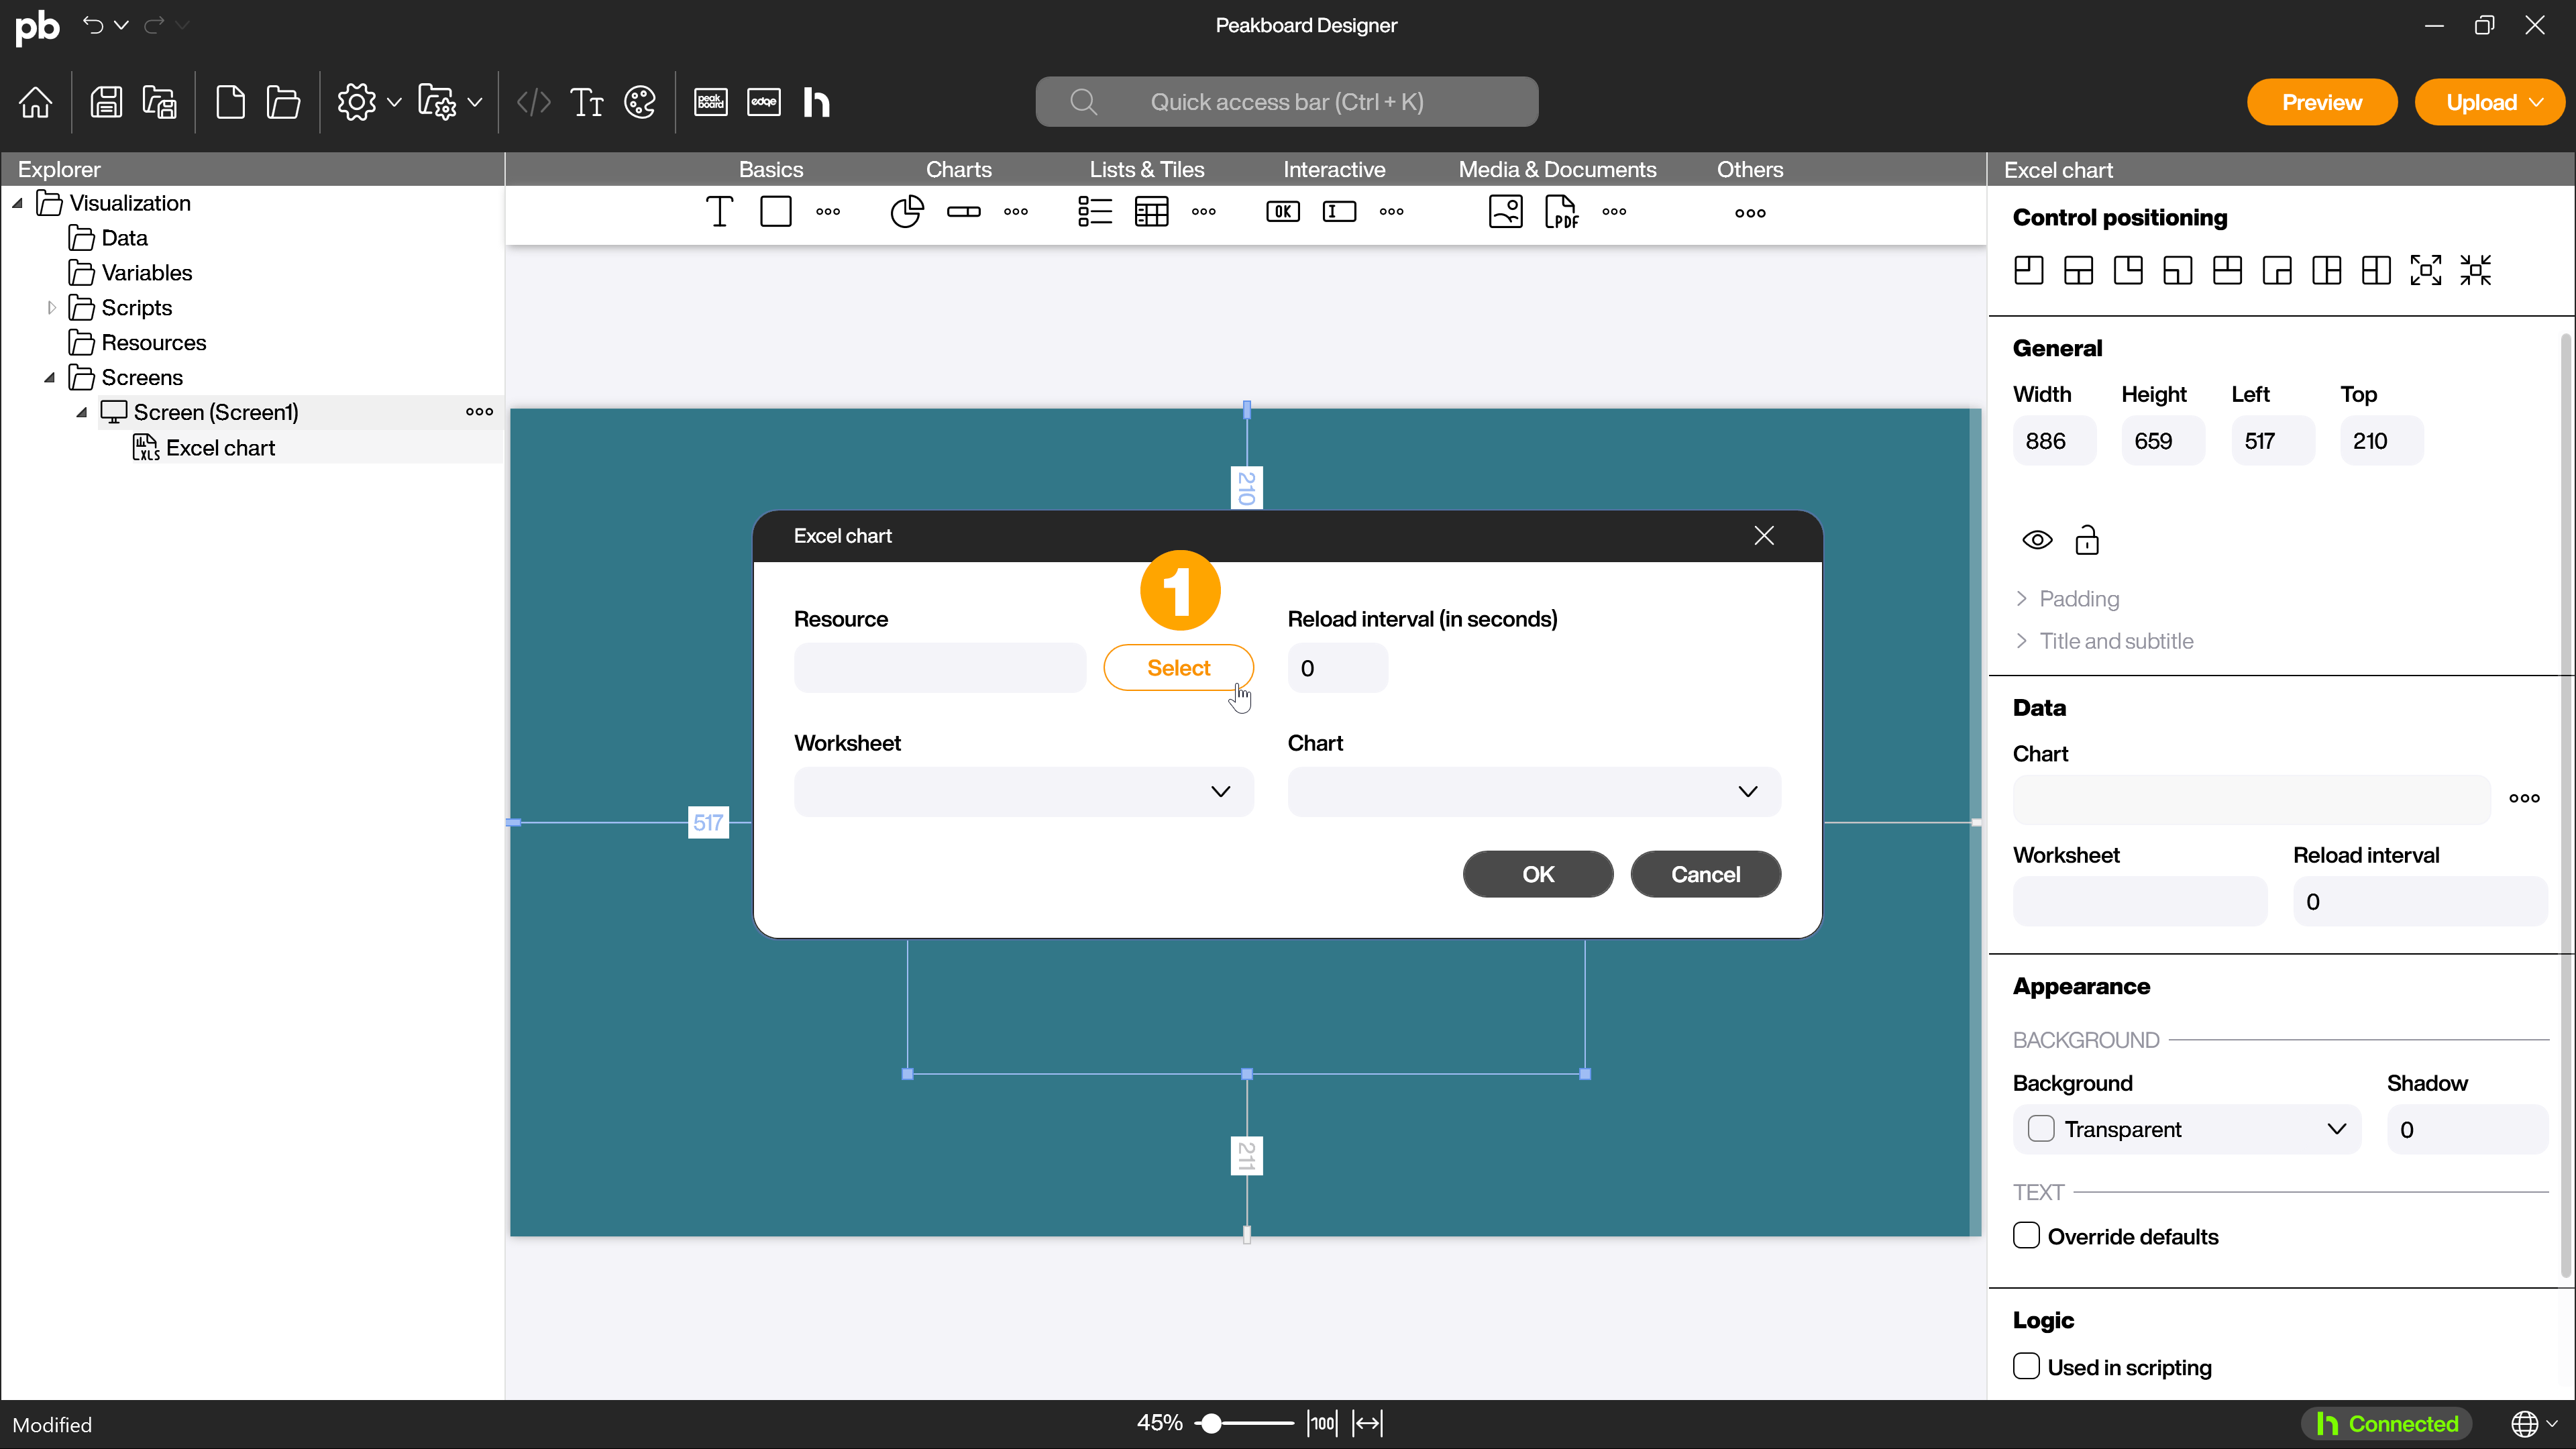
Click the [Select] (1) button to select an Excel resource. If you don’t have a resource in your application yet, you can add a resource at this point. The selected resource must contain the data for the chart as well as the chart itself. If several charts are included, it is important to know the name of the desired chart in the Excel file. Alternatively, you can include the resource in your application before adding the control.
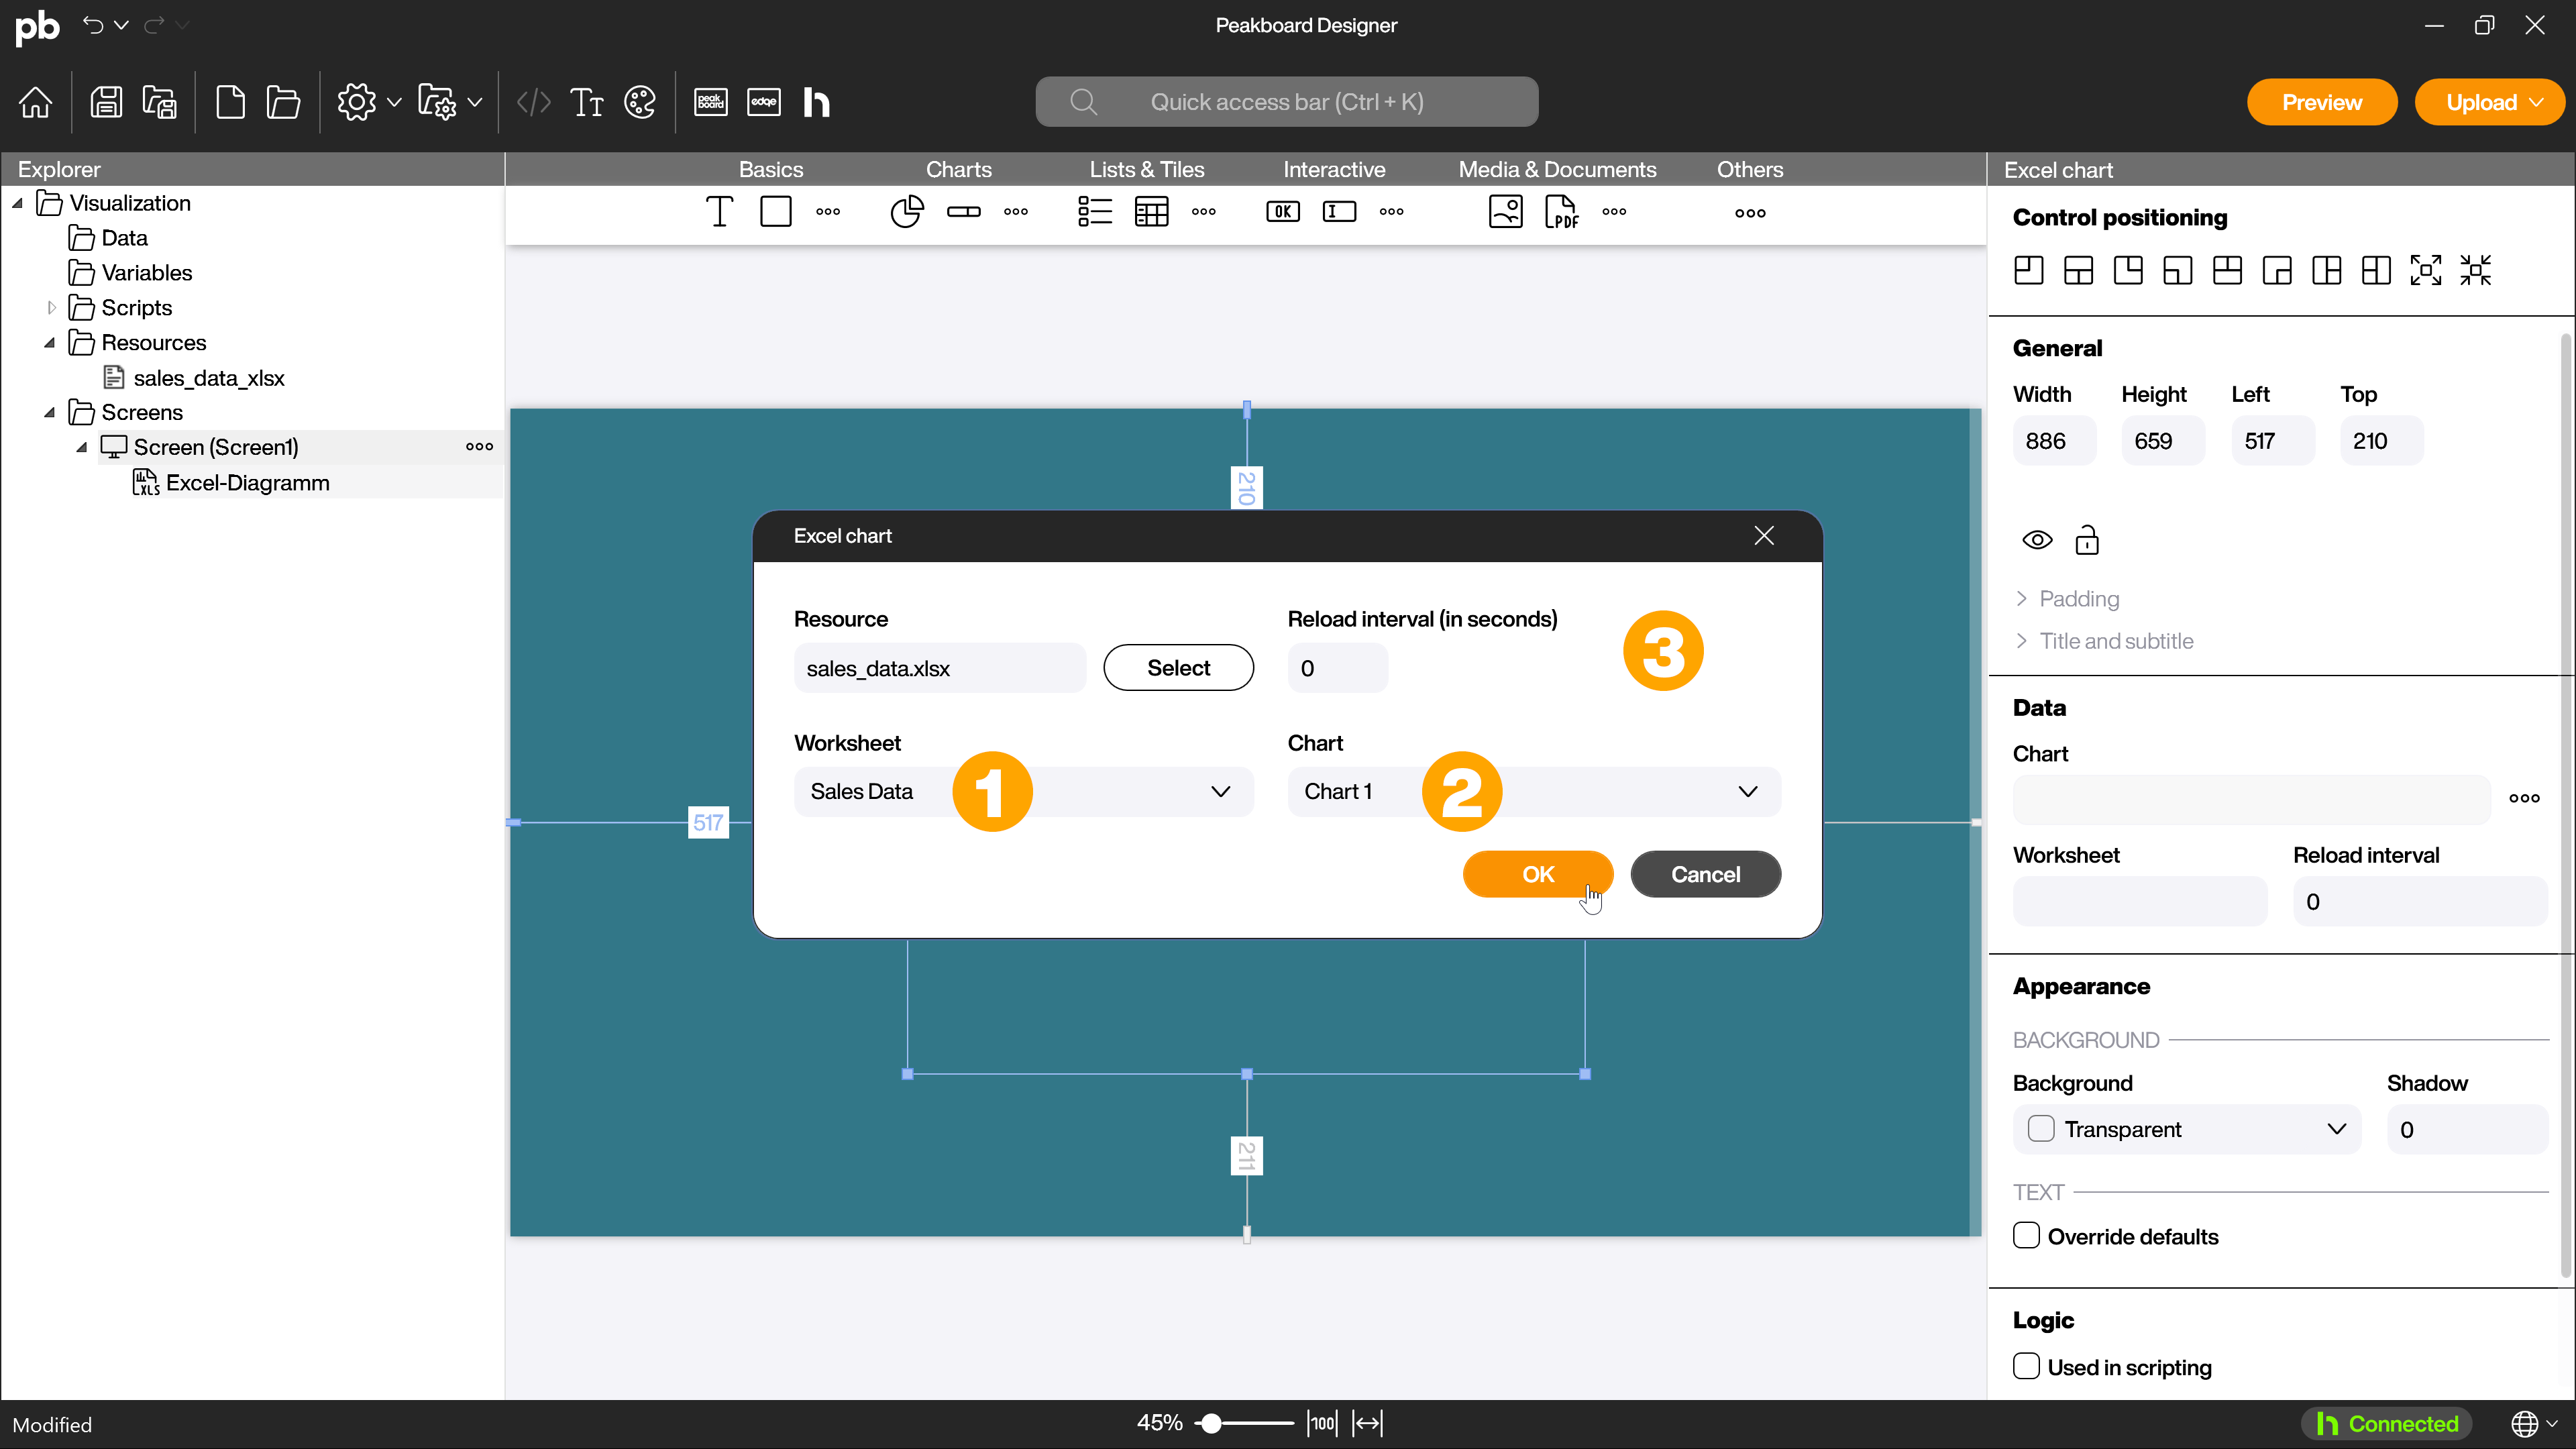
Select the desired worksheet (1) and chart (2) by name from the drop-down menu. Then define a reload interval (3) for the control.
Note:
The chart does not always correspond 1:1 to the template from the Excel file for technical reasons.
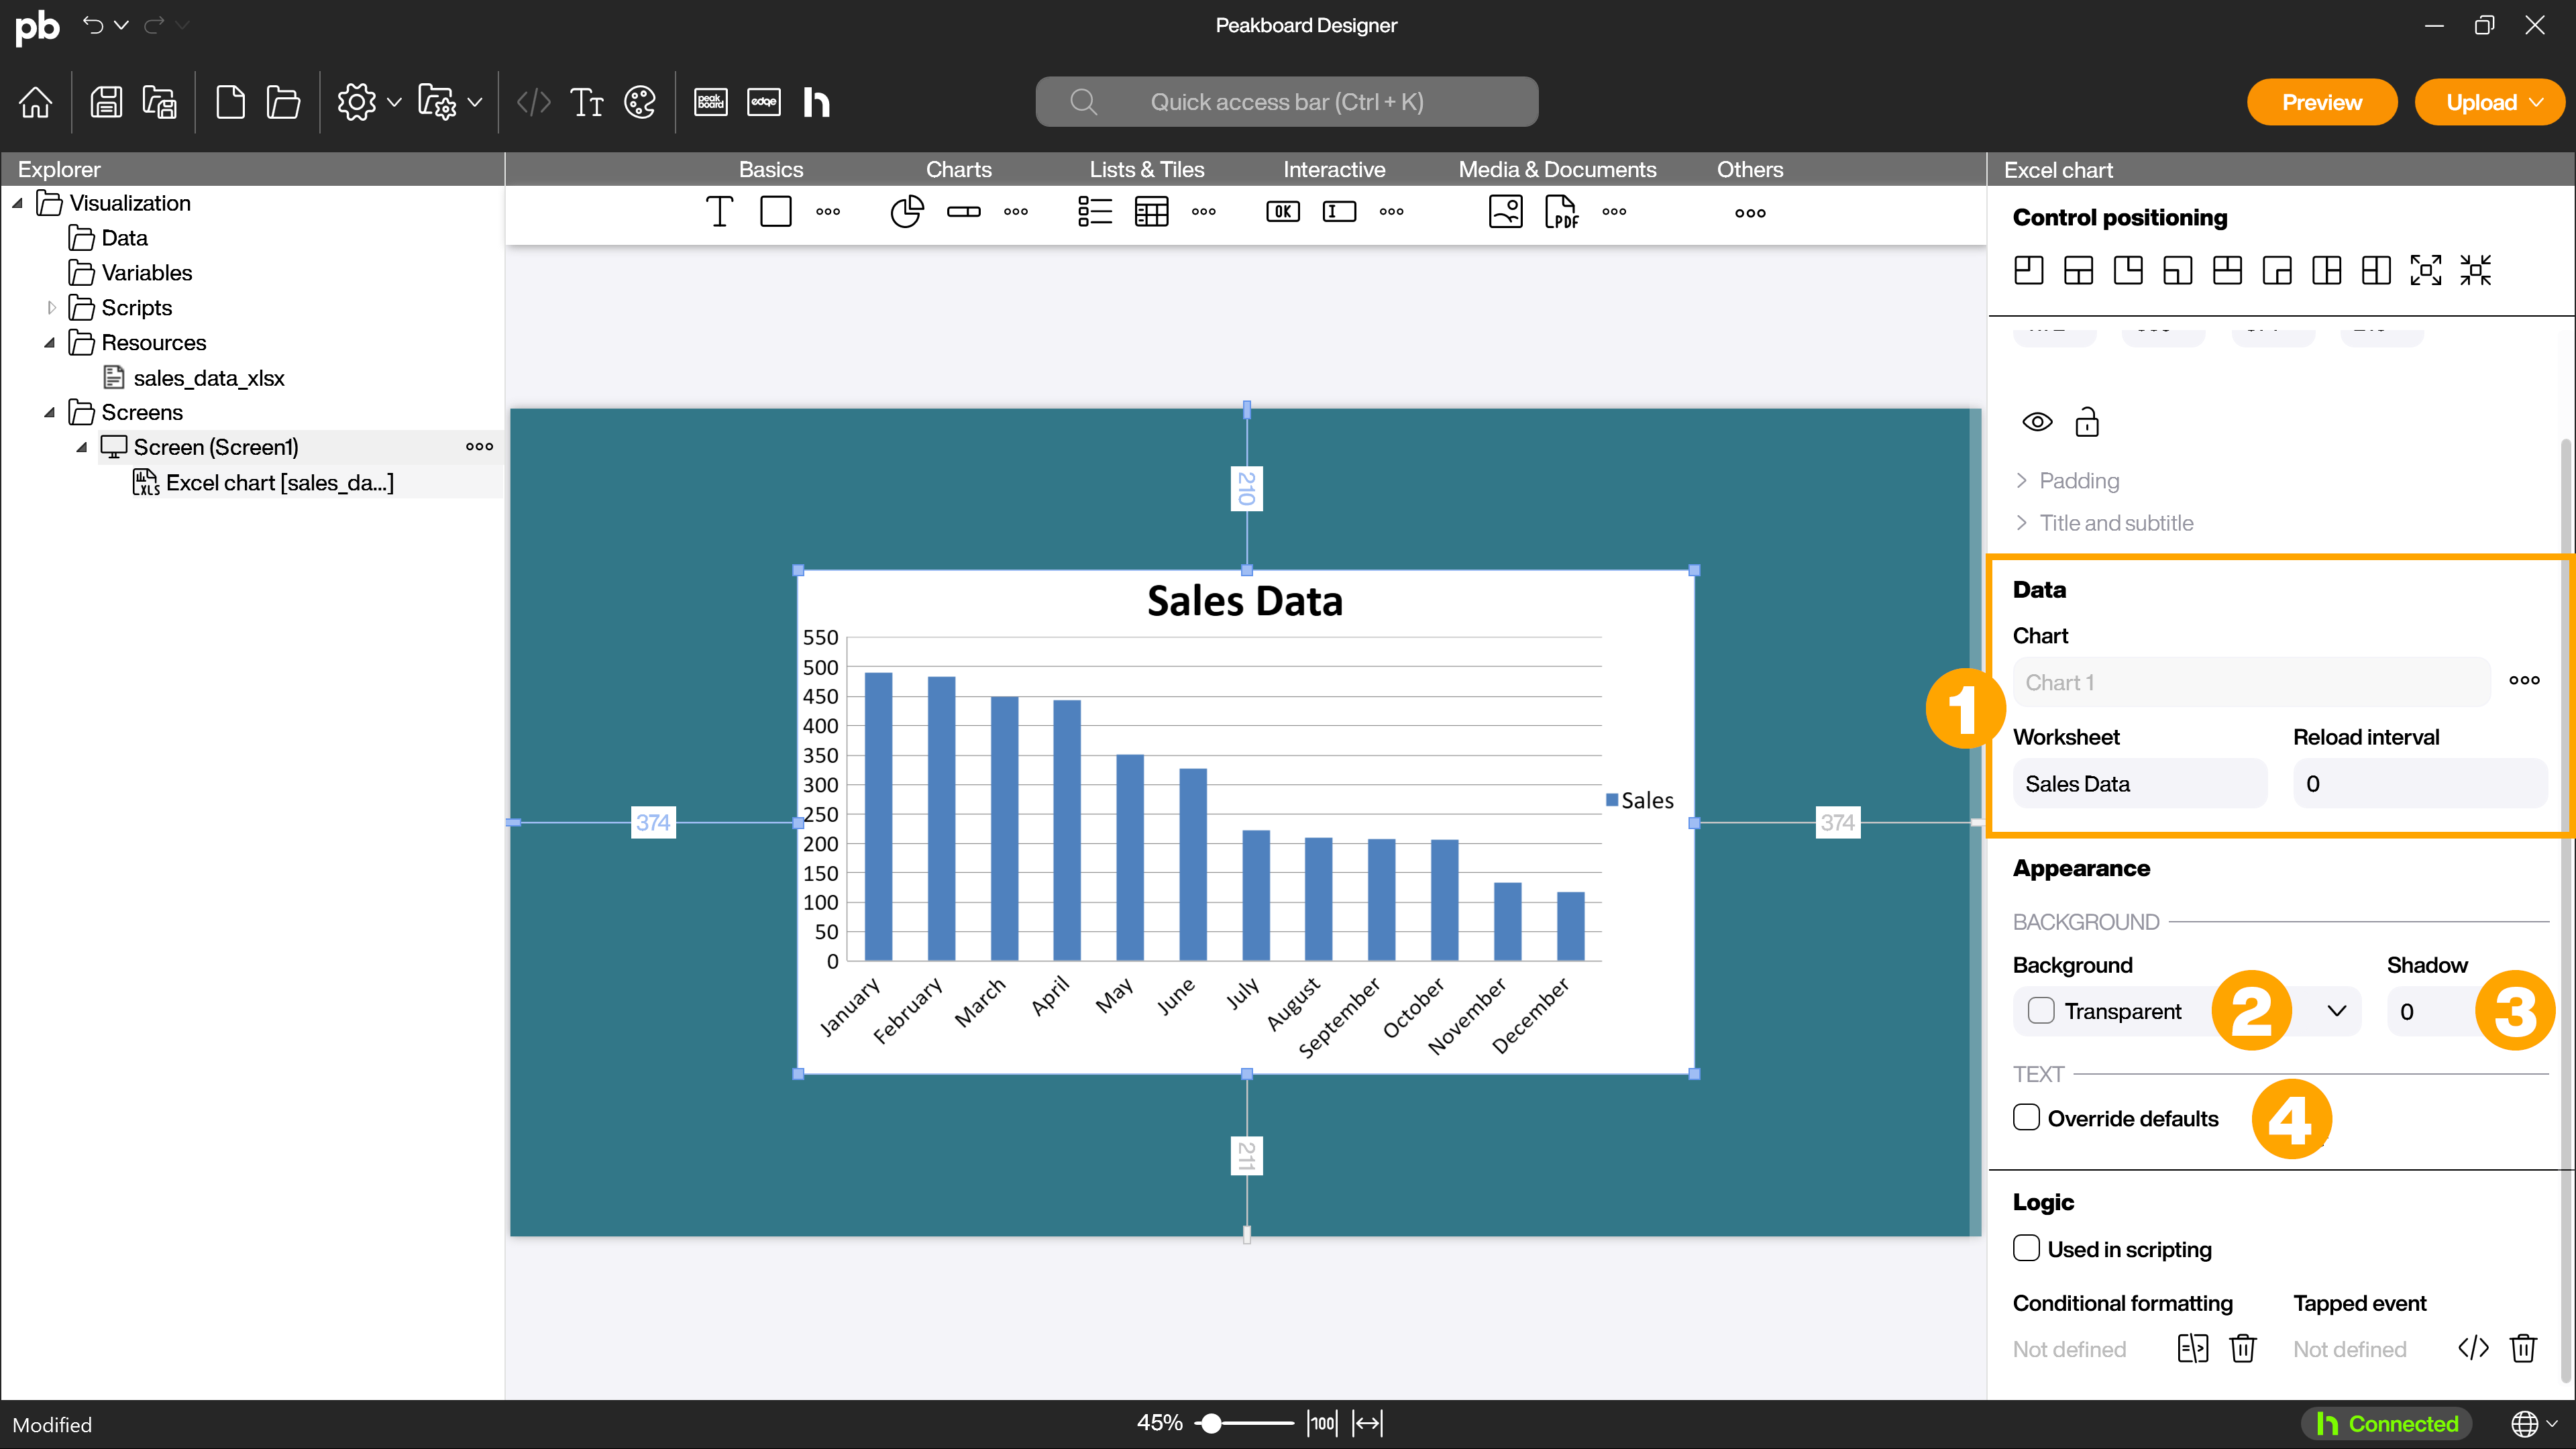
Attributes of the Excel chart control
In the attributes, you can access the settings dialog of the control again in the [Data] (1) area as an alternative to double-clicking on the control. In the [Appearance] area, you can define what the background of the control should look like (2) and add a shadow (3). You can also customize the appearance of the diagram labels in the [Text] area (4). By default, these are defined by Excel. Activate the [Override defaults] checkbox to specify which fonts are used in the chart for the individual areas.