Scripting
Building blocks
Peakboard offers you conditional formatting, a tool for data-dependent display logic, and dataflows, a way to prepare incoming data for your project. In order to be able to fulfill more complex requirements and ideas without extensive programming knowledge, you can use the Peakboard building blocks to assemble your code with graphical blocks.
Peakboard building blocks in the script editor
In the script editor, you have the option to select whether you want to combine the required code with the help of the Peakboard building blocks or write it yourself using the slider at the top right.
Caution.
It is possible to switch from the graphical view of the building blocks to the written code by pressing the slider, but it does not work the other way around.
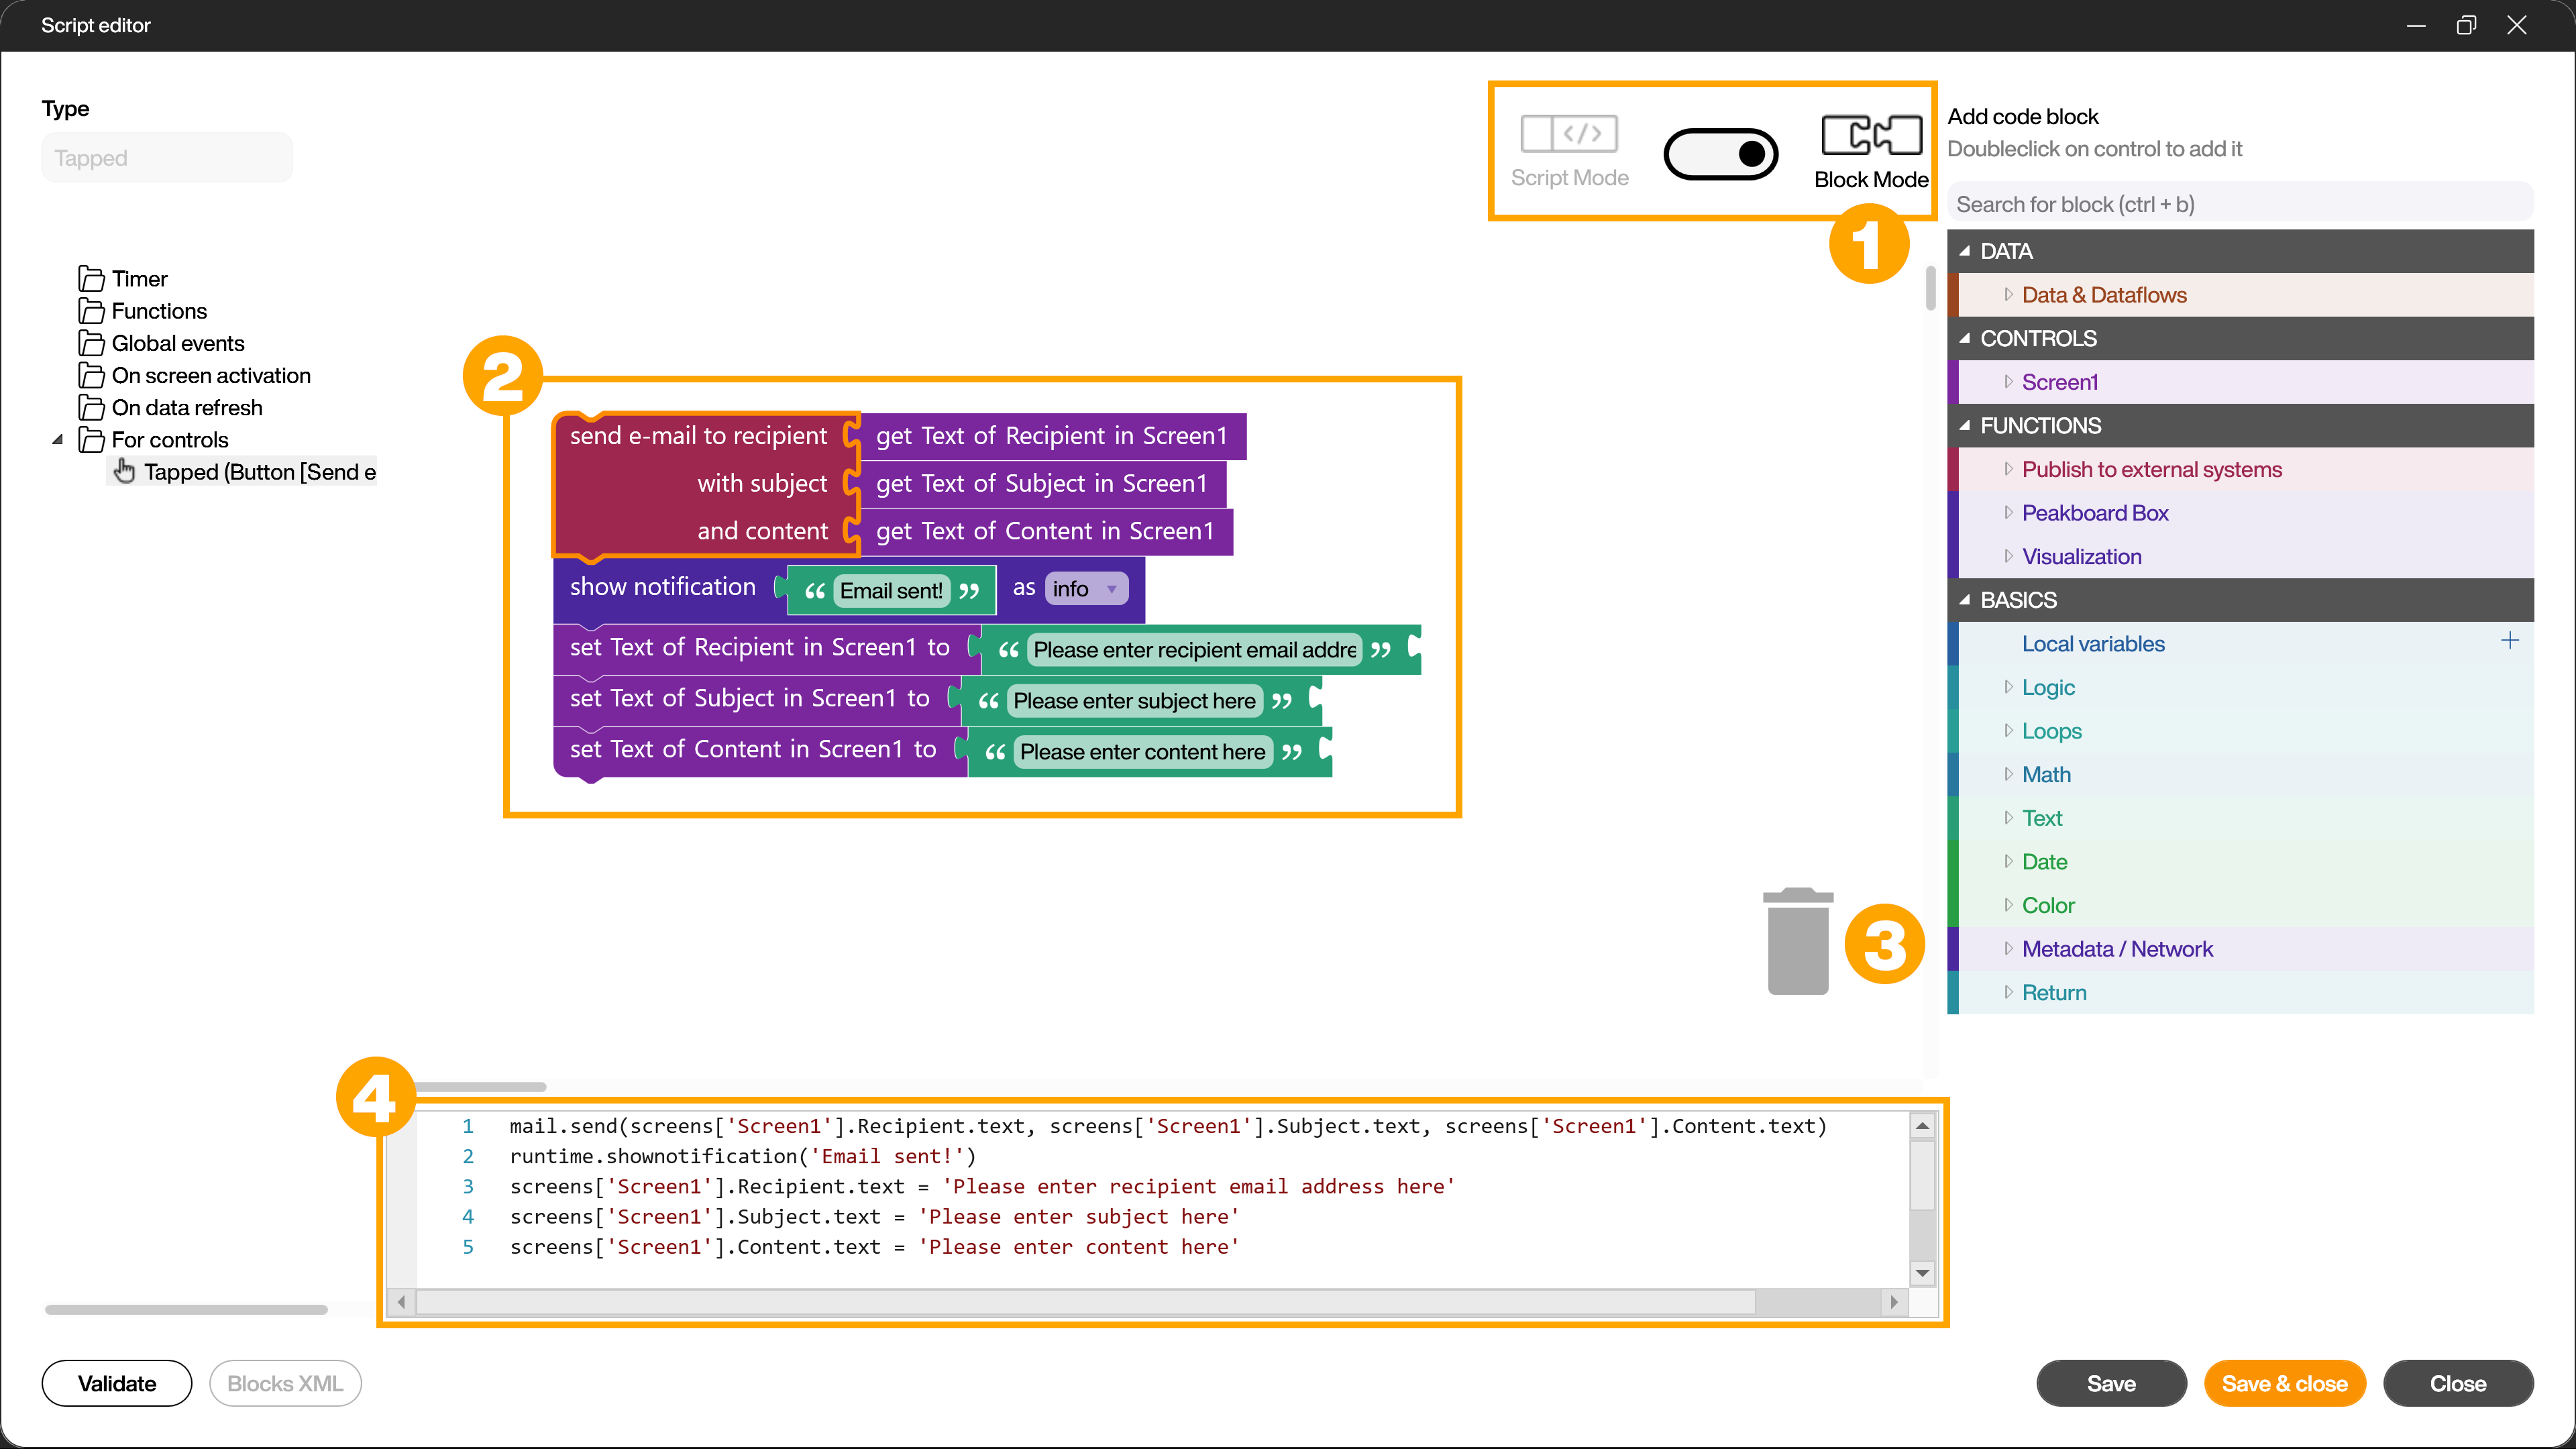
Depending on the selected mode, the script tree on the right side will change. Select [Block Mode] (1) to work with the Peakboard building blocks. Each building block corresponds to a command and can be attached to the previous one by dragging and dropping and arranged as required by the flow logic. The assembled building blocks form a logical program flow that is later executed from top to bottom. Building blocks that are no longer needed can be deleted by dragging and dropping them into the trash can (2) or pressing the Del key. In the lower part of the script editor you can see the created script (3) connected to the building blocks.
The script tree
In the upper area of the script tree, you will find all the elements that were used in your current project. For example, if you have placed a text in your visualization and given the control a name, you can click [Set value] one hierarchy level below [text] to adjust its properties.
Create local variables
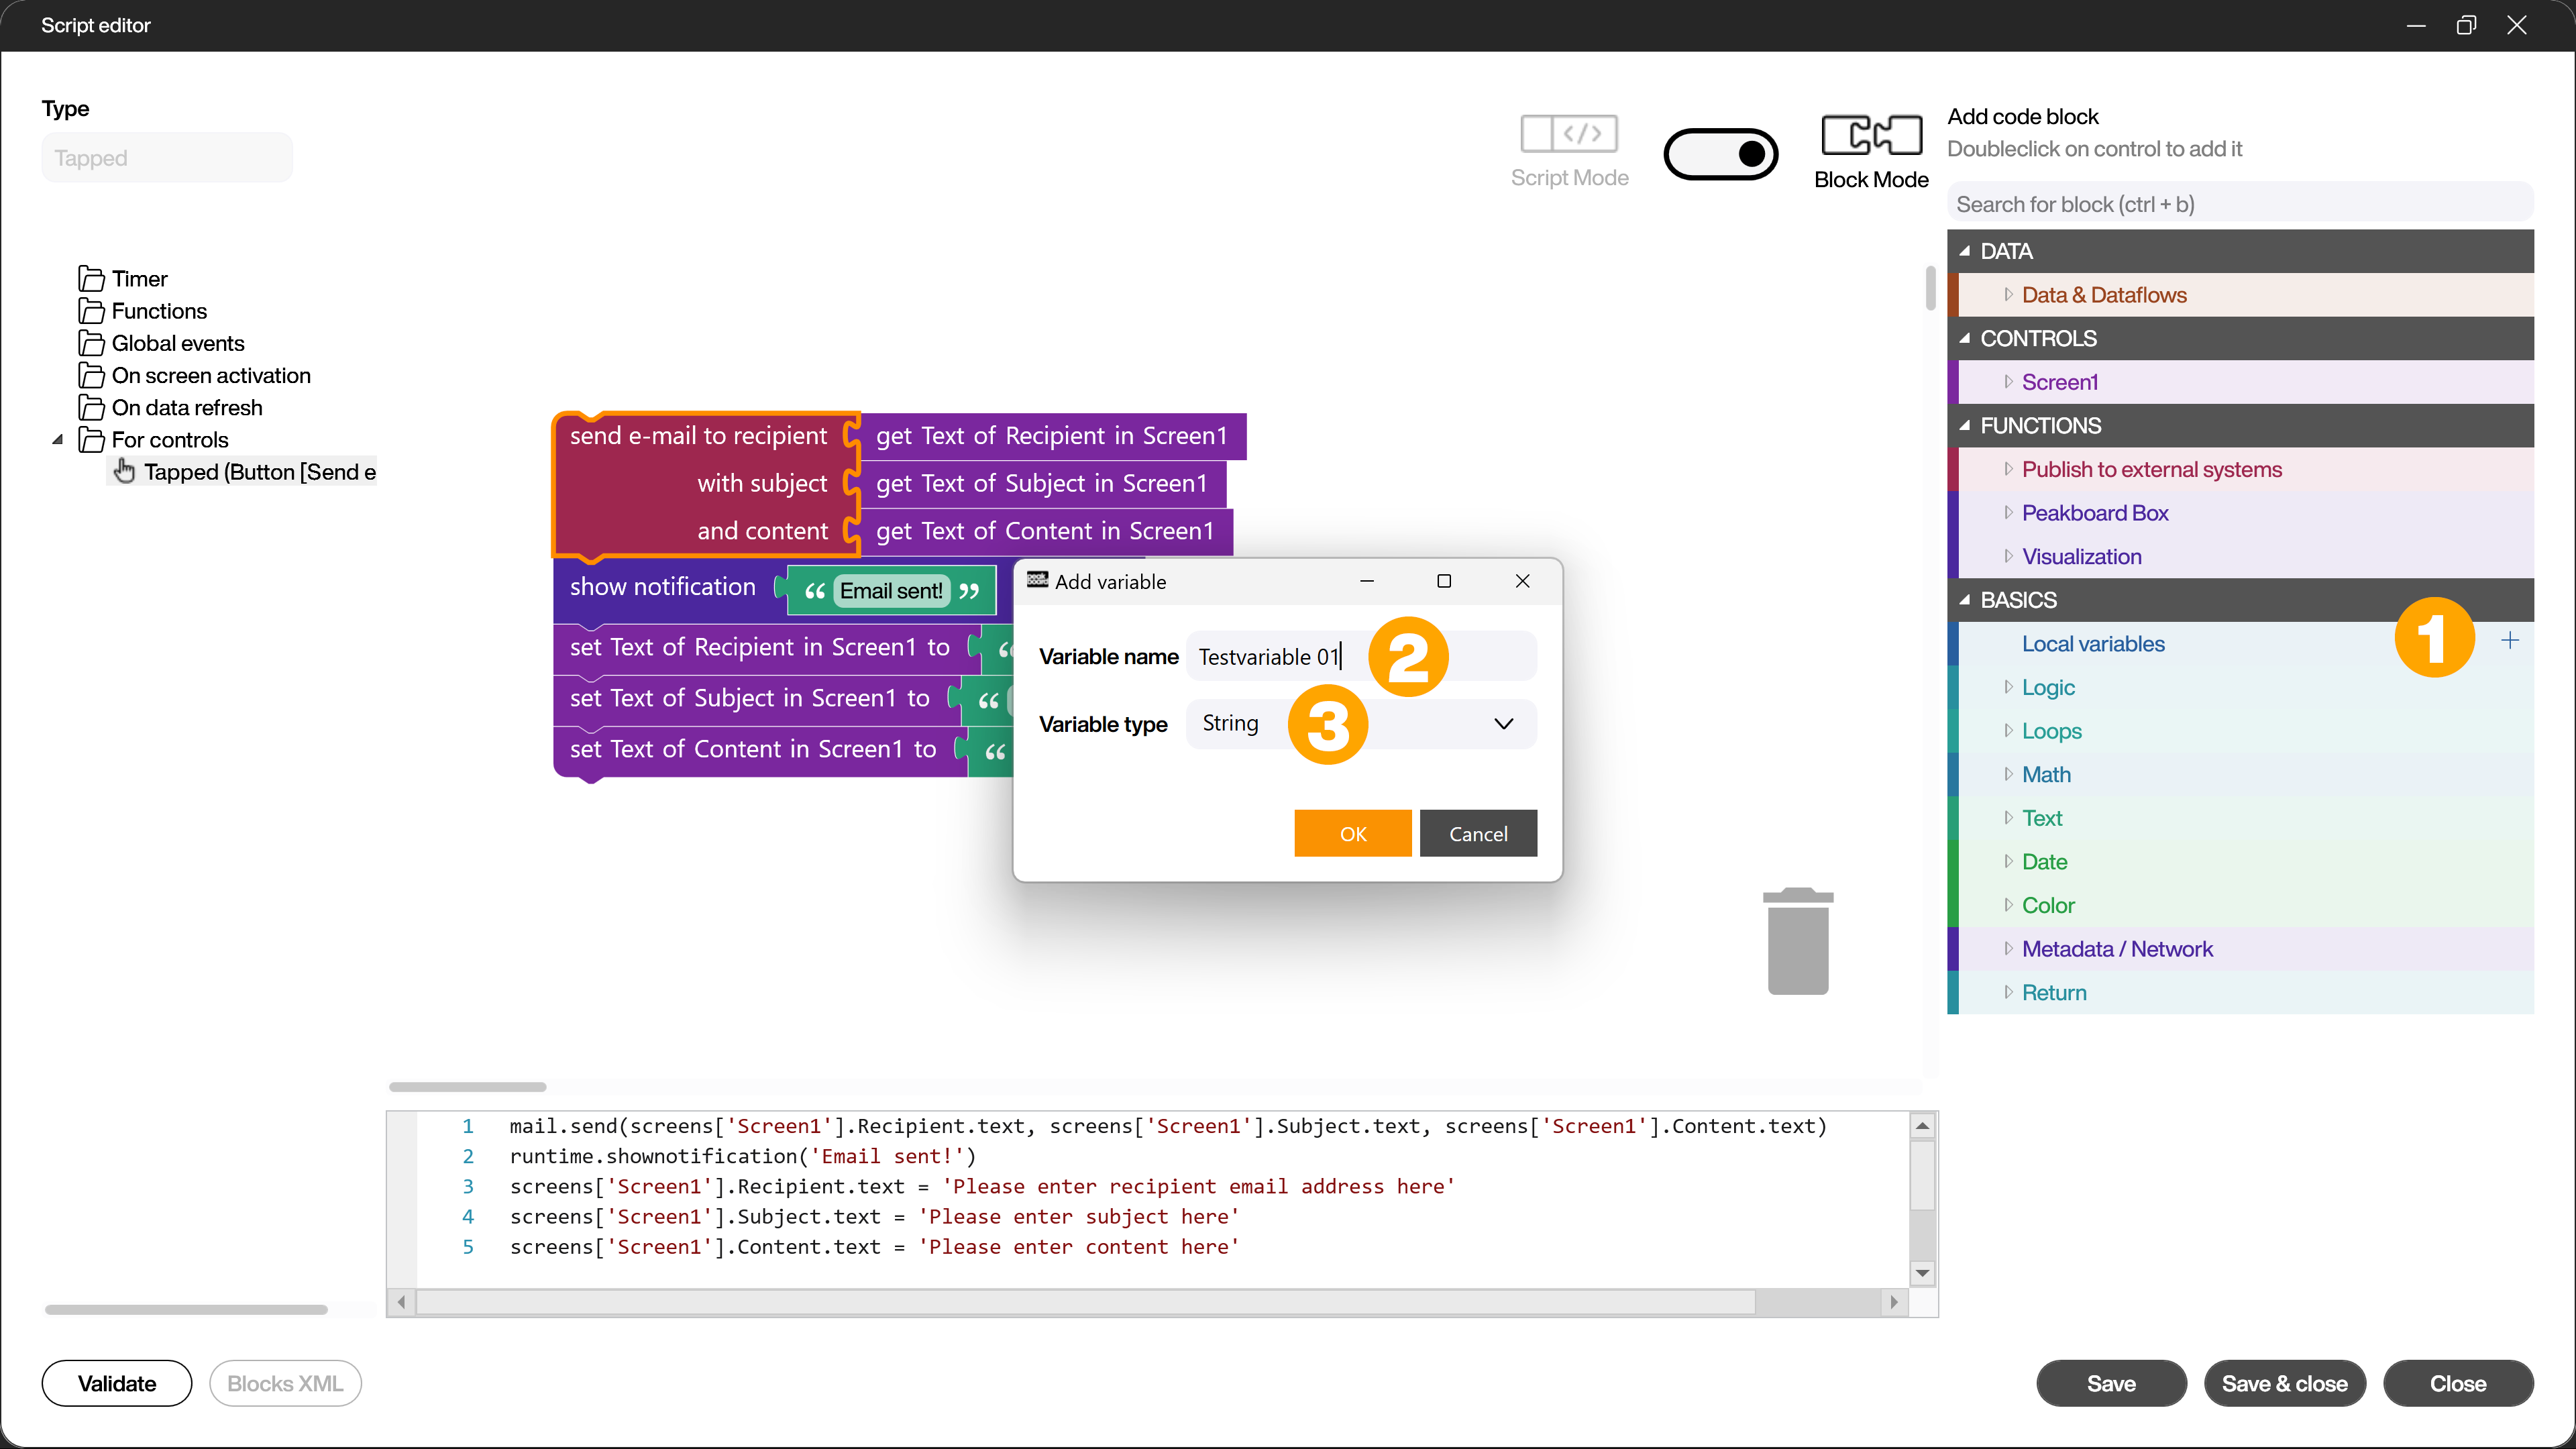
Further down in the script tree you will find the so-called local variables. Local variables are containers in which you can store values such as texts, numbers or lists. To create a new local variable, simply click on the [+] symbol (1), give the variable a name (2), select the desired data type (3) and confirm with [OK].
Example for a program flow
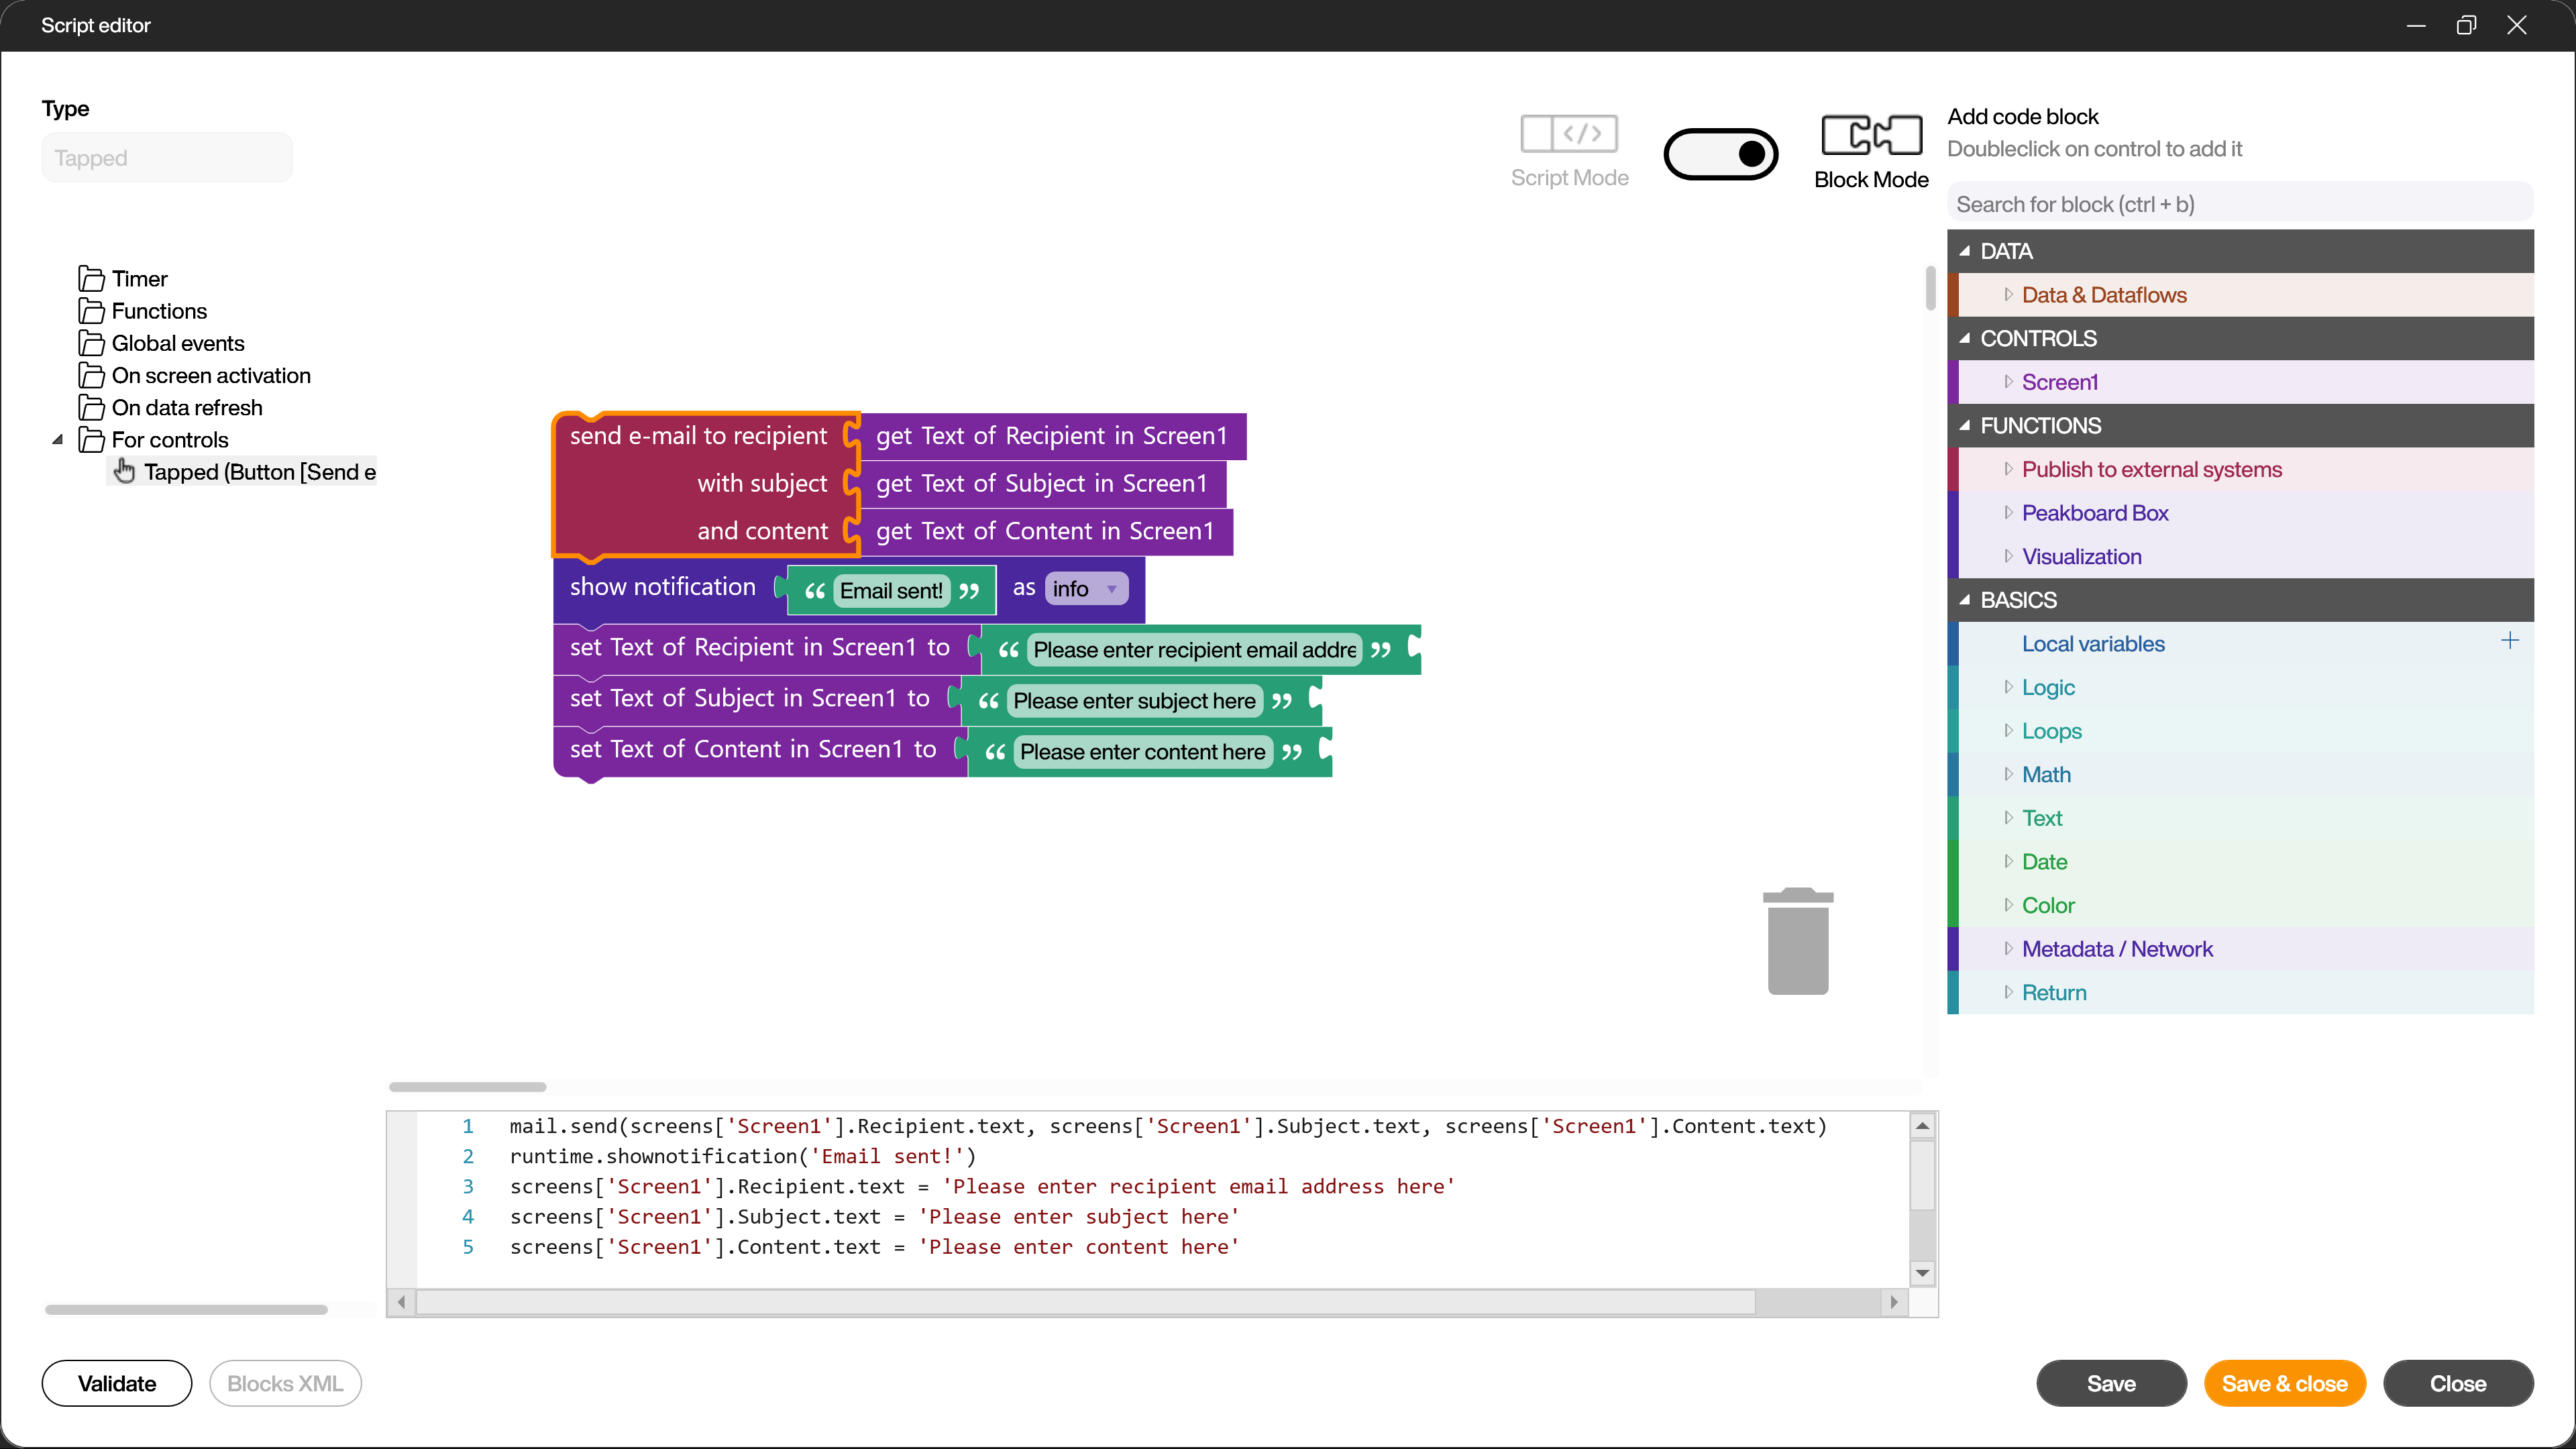
The following screenshot shows a program flow that allows you to send an email from your visualization via text boxes. Prerequisite for filling out the fields are suitable peripheral devices, such as keyboard and mouse or a touchscreen.
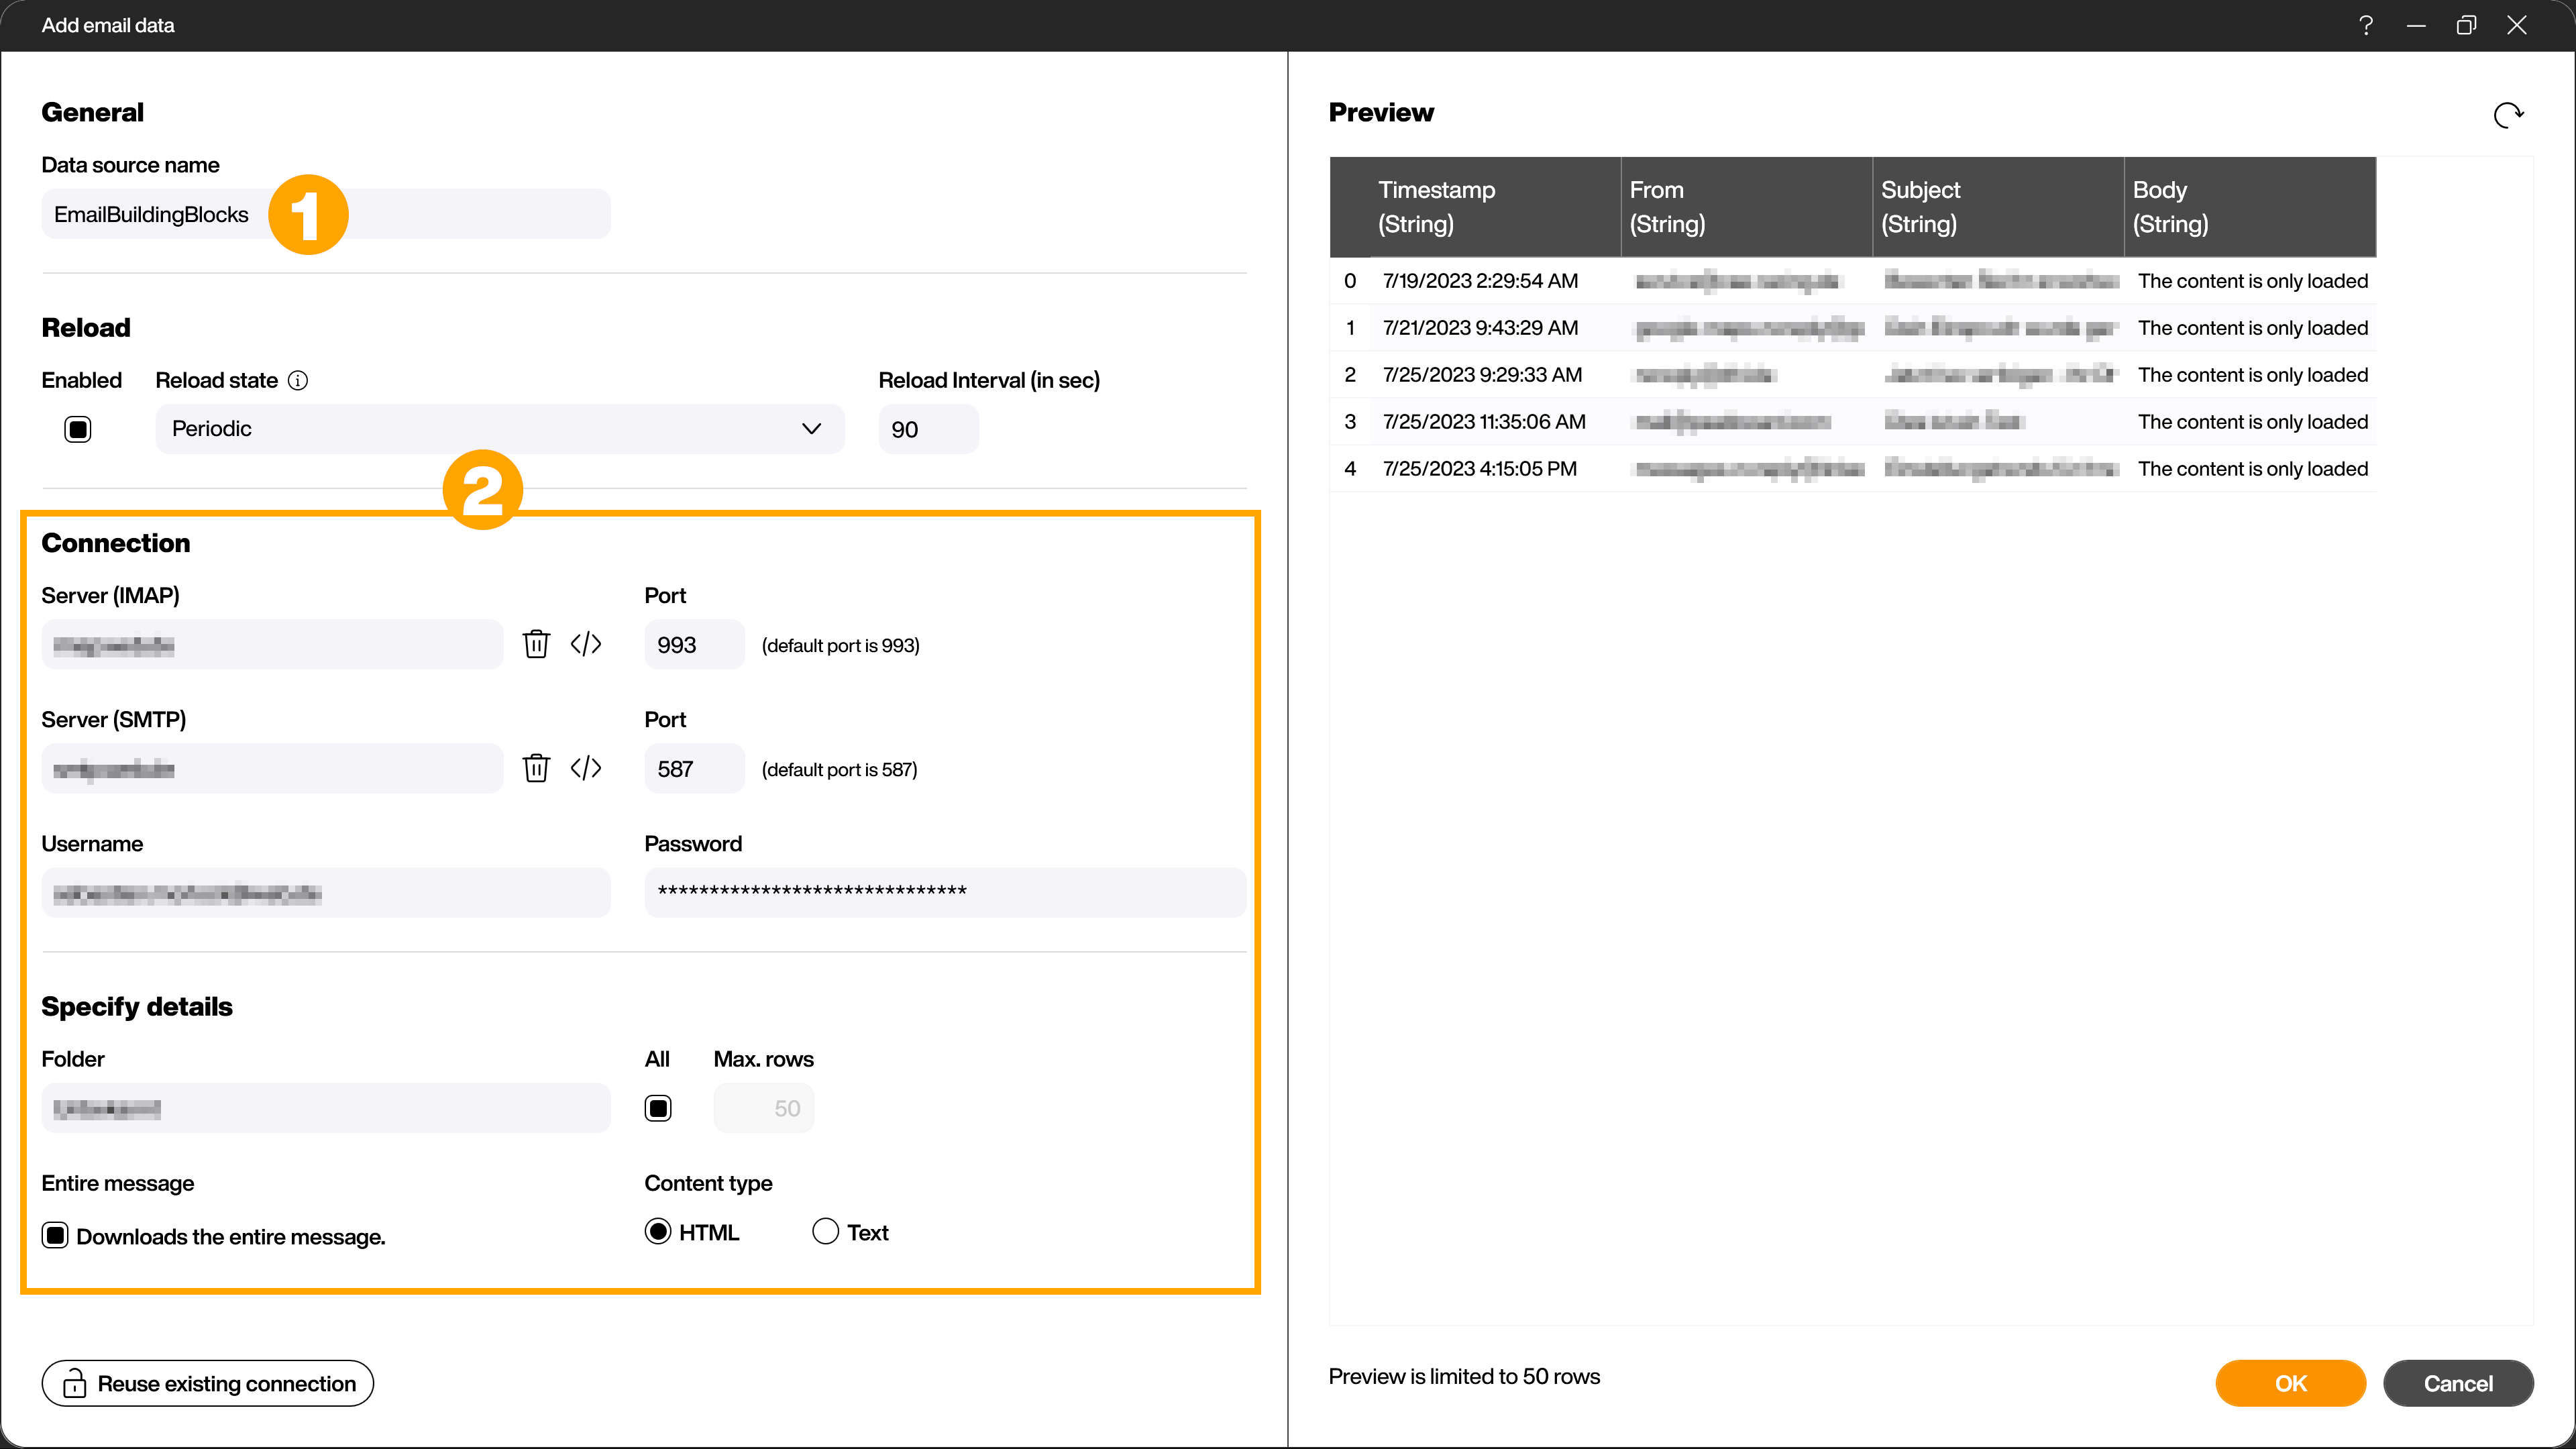
To prepare the program flow, create an email data source, give it a name (1) and fill it with the login information of the email account you want to use for sending the emails (2). Then click on [Load data] to see if the connection works. Alternatively, you can skip this step completely and go directly to the next step. You will then use the Peakboard server to send your email. The sender will then be [mail@peakboard.com].
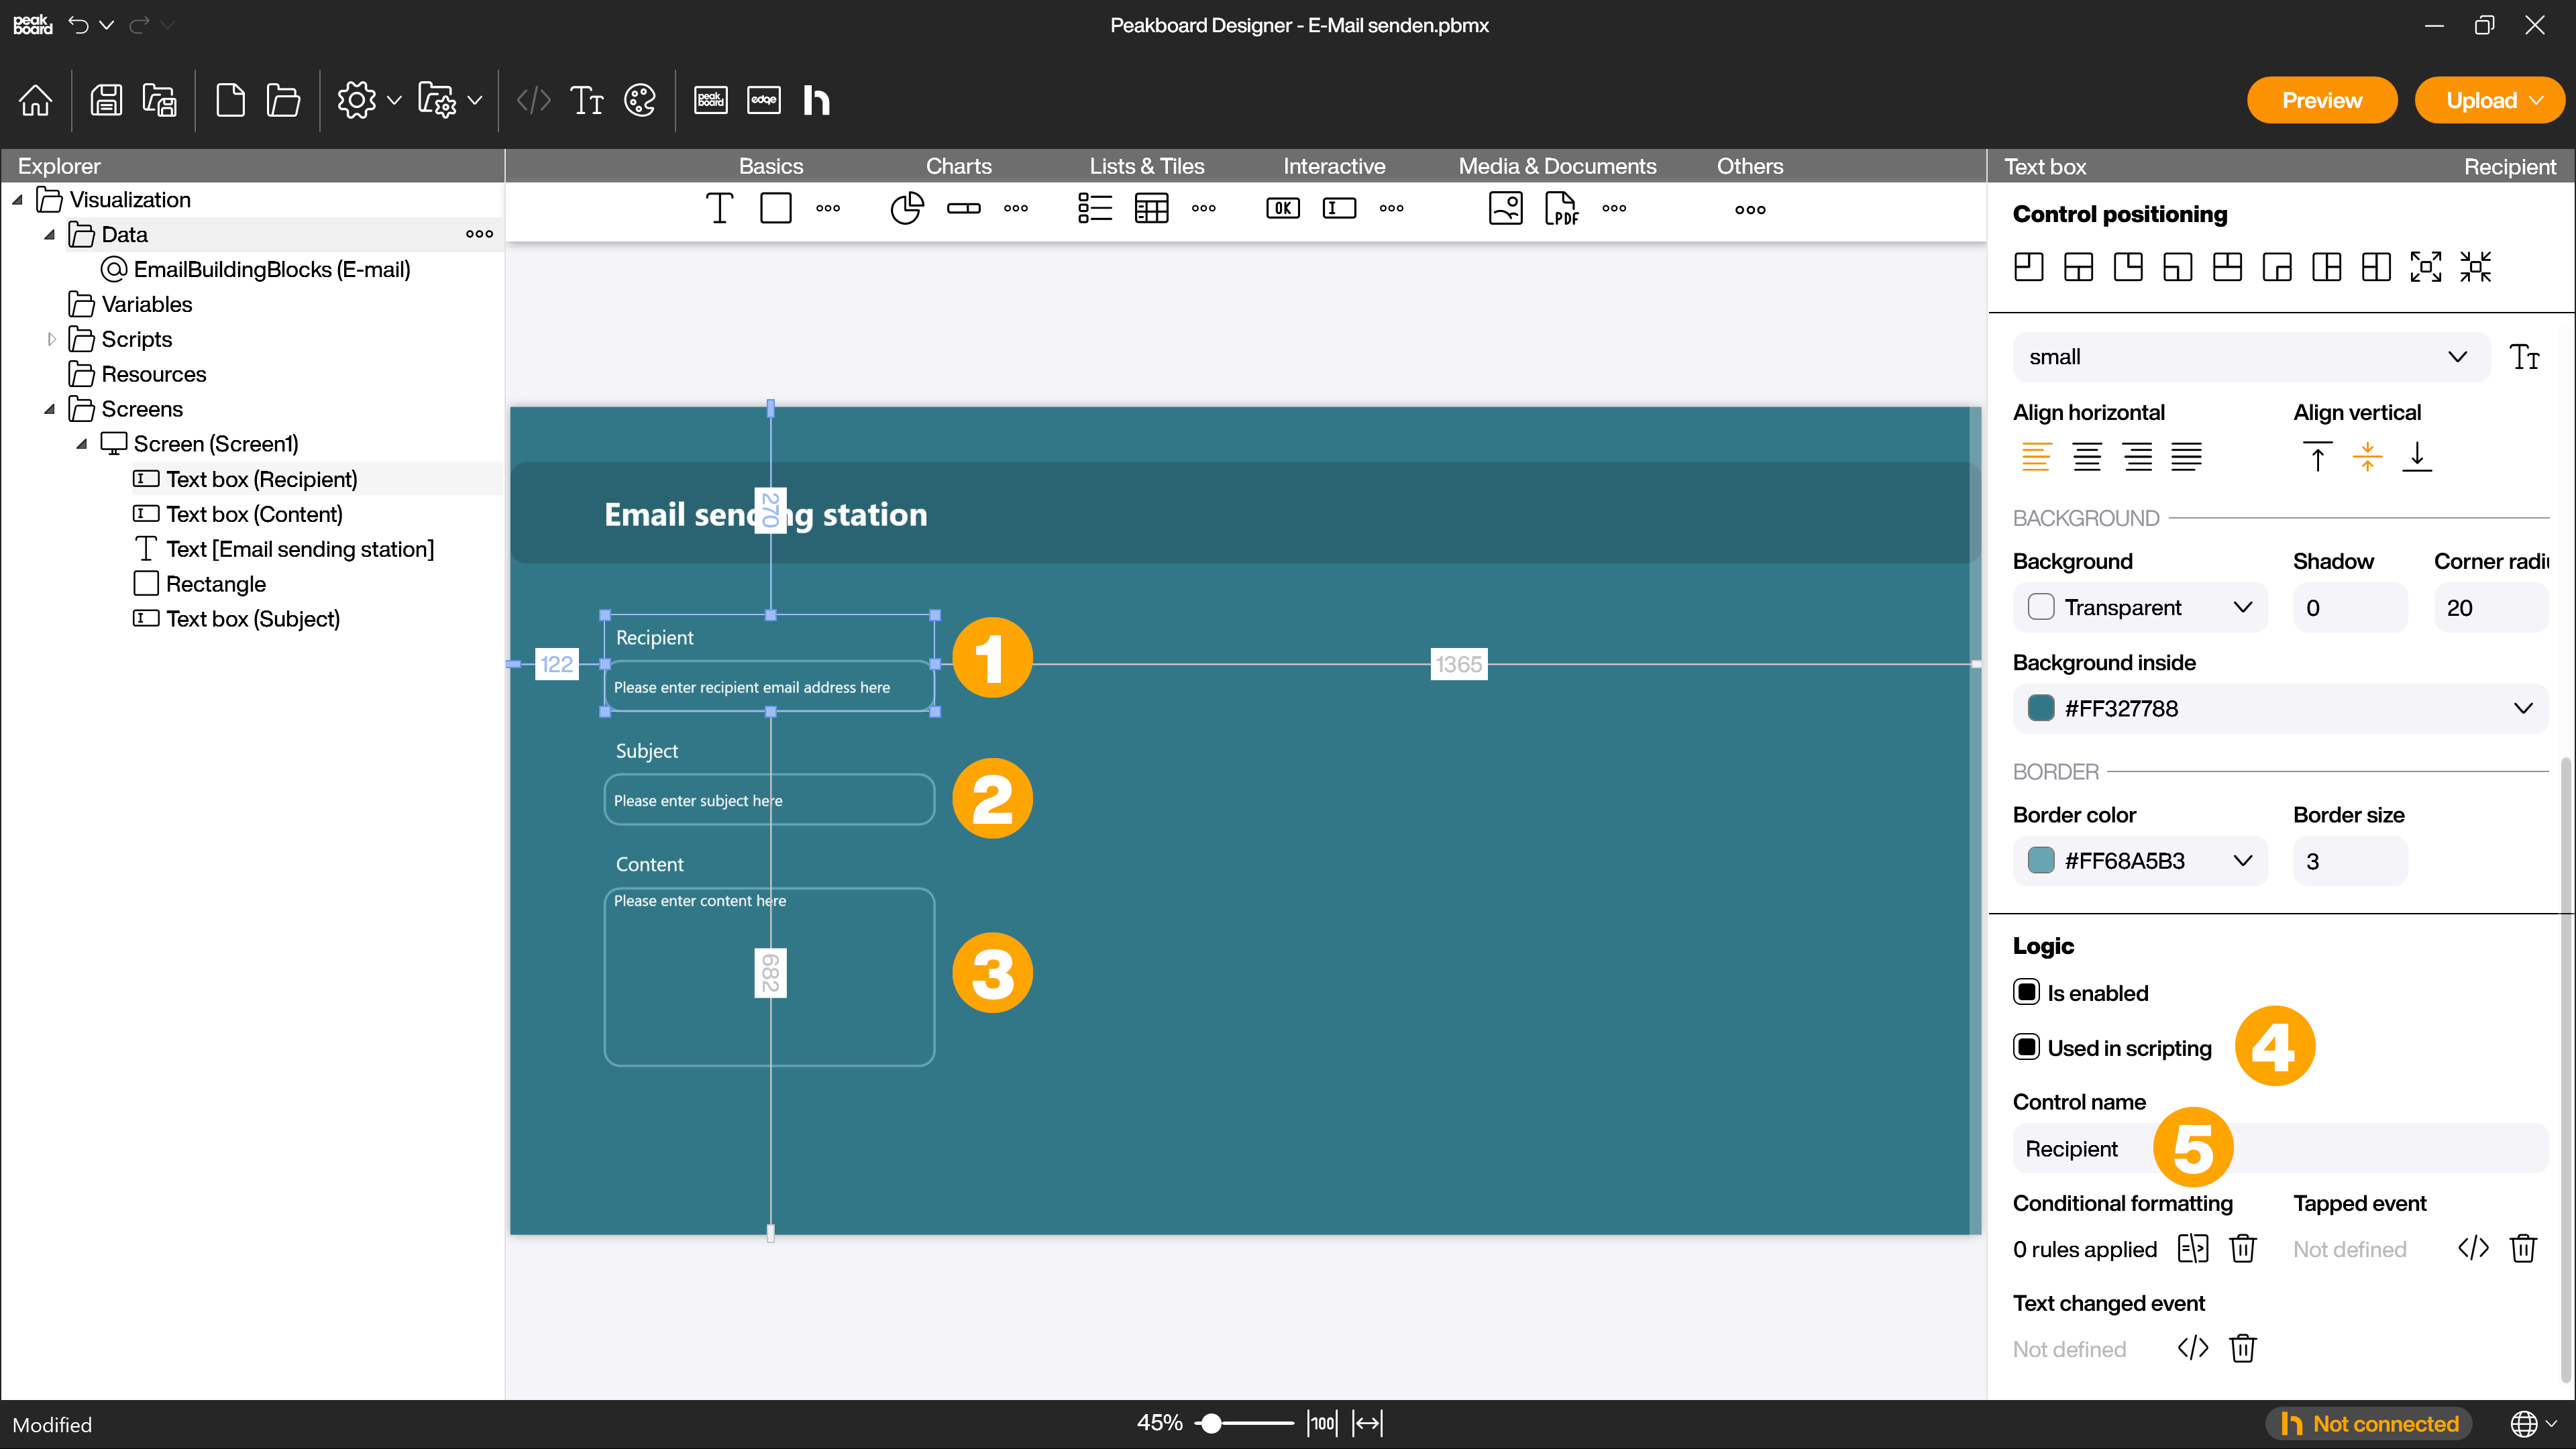
Create three text box controls [Recipient] (1), [Subject] (2) and [Content] (3). Activate the use in scripts (4) and assign suitable names (5). As text you enter a placeholder and give the controls matching titles.
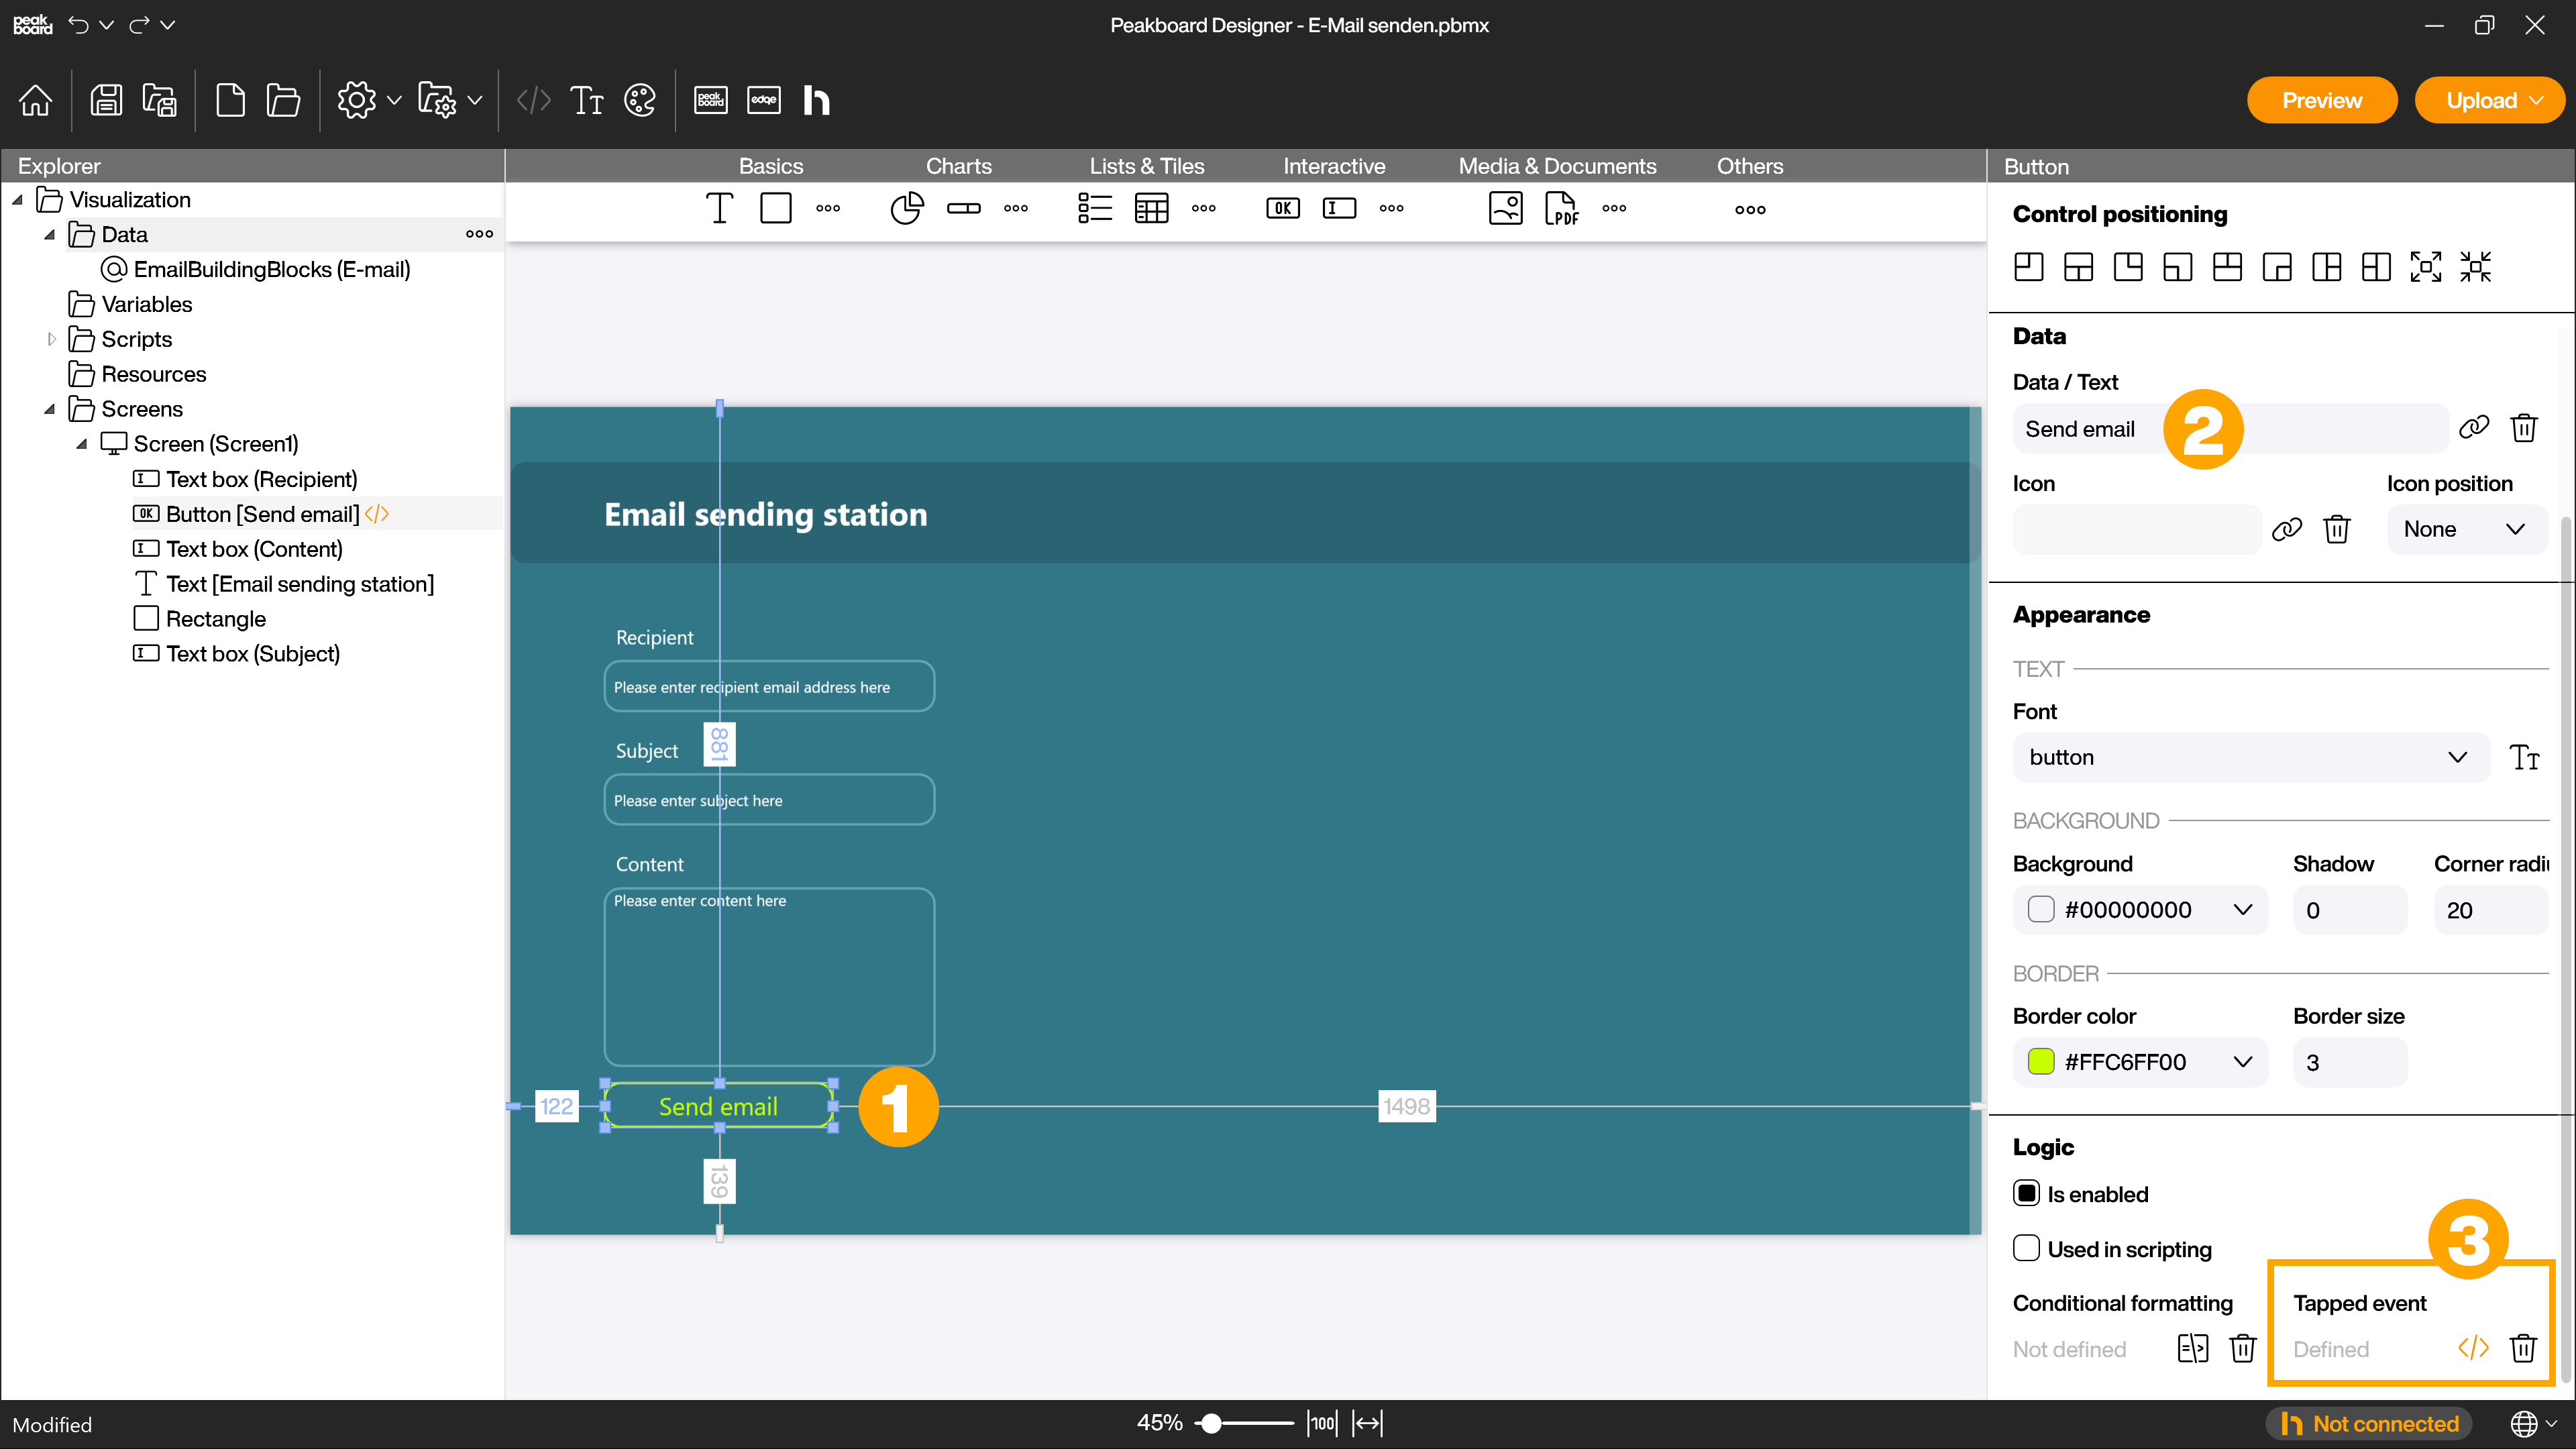
Finally you need a [Send email] button. Drag the button control onto the workspace (1) and enter [Send email] (21) as the text, for example. To get to the script editor, click on the [</>] symbol (3) in the attributes in the [Tapped event] area.
In the script tree, go to [FUNCTIONS], [Publish to external system], [Email] and again [Email] if you created your own email data source in the first step or to [Email via Peakboard Server] if you don’t want to use your own server for testing. In either case, drag and drop or double-click the [Send Email] building block onto the script editor canvas. You will then need to modify the default building block accordingly.
If you have created your own email data source, you have to select it in the added building block. To be able to use the previously created text boxes as input later, delete the three block parts on the right side by dragging them to the trash. Then go to the [CONTROLS] section of the script tree and to the corresponding screen on which you created the text boxes. Then drag the [Get value] building block from the [Text] area of the respective text box to the matching position of the previously created [Send email] building block.
To make sure that your email has been sent, add another building block at the bottom of the current program flow. To do this, go to the [FUNCTIONS] area and select the building block [Show notification/error] under [Visualization] and drag it to the bottom of the existing block. Enter your desired notification in the empty building block area and select [Info] from the drop-down menu.
To ensure that the next user of your email form cannot read the most recently sent message, add three more building blocks to the existing program flow that reset the entered content of the text boxes to your desired placeholder text. To do this, select the appropriate screen with the text boxes in the [CONTROLS] area again and drag the [Set value] building block from each of the three text box controls under [Text] below the existing program flow. Then fill the empty areas of the building blocks with your placeholders.
In the bottom area you can also see the finished script written out. The following script example shows the version without custom email data source.
mail.send(screens['Screen1'].Recipient.text, screens['Screen1'].Subject.text, screens['Screen1'].Content.text)
runtime.shownotification('Email sent!')
screens['Screen1'].Recipient.text = 'Please enter recipient email address here'
screens['Screen1'].Subject.text = 'Please enter subject here'
screens['Screen1'].Content.text = 'Please enter content here'
Finally confirm your program run with [Save & Close].
Open the [Preview] to test your program flow. Wait until your visualization has loaded and enter a recipient, the subject and the content of your email. Then click on the [Send email] button. If everything worked, you should now see the notification and the text boxes should contain the specified placeholder text again. The recipient should have received the email as well. If you open the log in the preview by clicking on the triangular exclamation mark icon, you should only see the message [Mail successfully sent].