Data sources
Excel
This article explains how to use an Excel file as a data source in Peakboard. Excel is a good fit wherever data is already maintained in a spreadsheet – from a local .xlsx file on disk or a network drive to OneDrive or SharePoint. More information about the file format is available directly from microsoft.com.
Throughout this article we use the file production-lines.xlsx as a running example. It contains the worksheet Lines with the columns Line, Product, Status, Output, Target and OEE, listing five production lines of a factory.
Add the data source
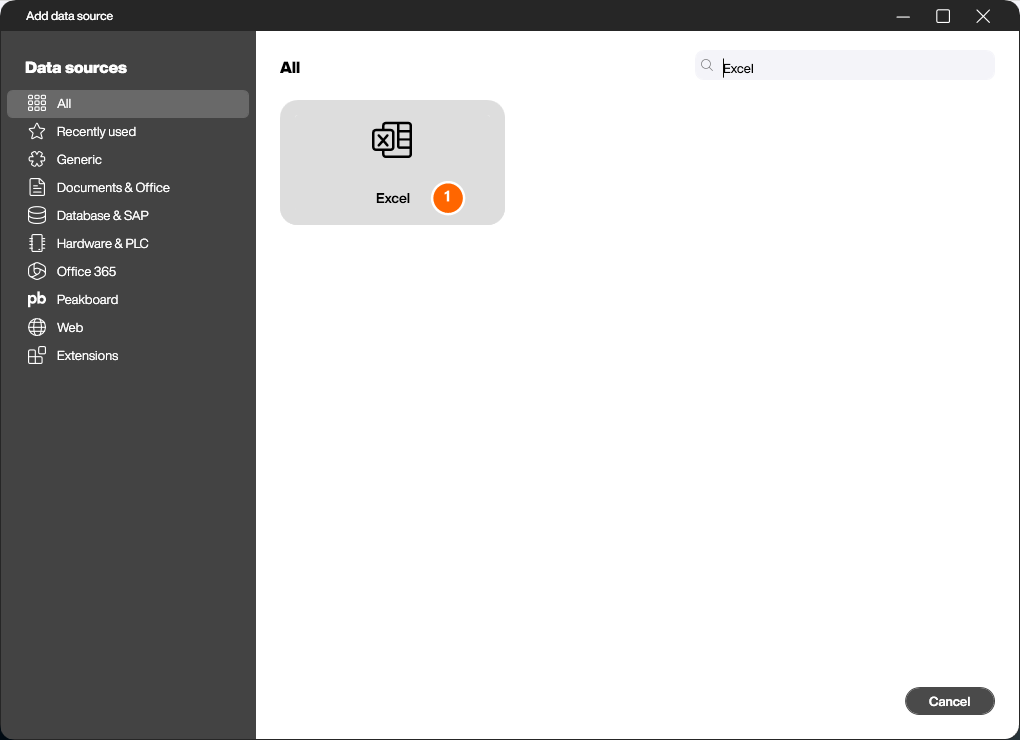
In the Explorer, select [Data] and click the plus button to create a new data source. In the following dialog, select the data source [Excel] (1) – the search box in the top right is the fastest way to find it.
Configure the Excel data source
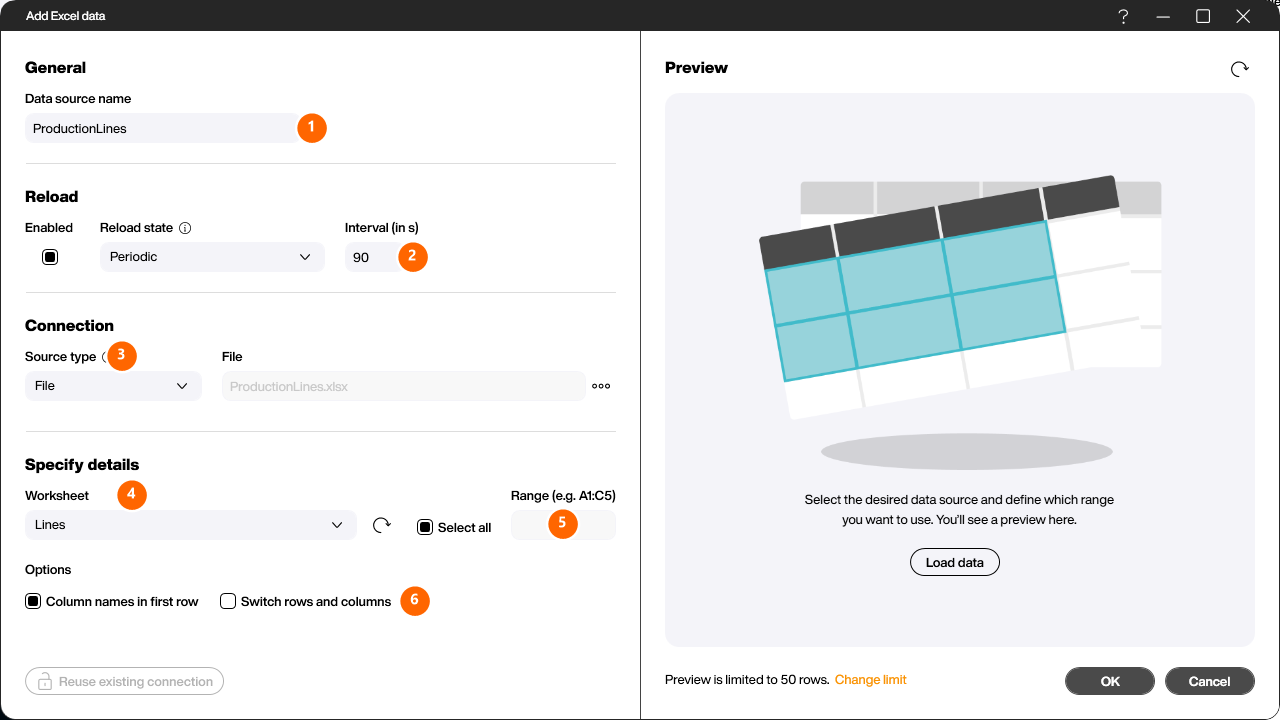
In the [Add Excel data] dialog, first give the data source a name in the [General] section (1).
In the [Reload] section (2) you define whether and at which interval (in seconds) the data is reloaded automatically. Under [Reload state] you choose between [Startup] (once at start), [Periodic] (cyclically at the given interval) and [Manual] (only when you trigger the reload via a script).
In the [Connection] section, [Source type] (3) determines where the file comes from:
- URL – retrieval via a web address.
- NetworkShareFileDirect – direct access to a file on a network drive, specifying the desired domain user and password. Note that the UNC drive paths must be used.
- File – a local file that is imported into the project as a resource and becomes part of the
.pbmxfile. This is handy when you want to work with the data offline at the beginning of a project. - Office365 / Hub – a file from SharePoint or OneDrive (both the free and Microsoft 365 versions), or from the Peakboard Hub.
In our example we choose [File] and the file production-lines.xlsx.
Important An Excel file you add as [File] only contains the data that was current when the file was added to the resources. To display real-time data, you should choose one of the other sources.
In the [Specify details] section you define how the file is interpreted:
- [Worksheet] (4) – the worksheet the data is read from. Use the refresh button next to it to reload the list of available worksheets.
- [Select all] / [Range] (5) – by default [Select all] is active and the entire worksheet is used, starting from the first populated cell. If you deselect [Select all], you can enter a [Range] in which Peakboard should look for the data (for example
B2:H23). - [Options] (6) – when [Column names in first row] is enabled, the first row is interpreted as the column headers; otherwise the columns are given generic names (Column0, Column1, …). [Switch rows and columns] lets you transpose the data with a single click, swapping rows and columns.
Load the data and check the preview
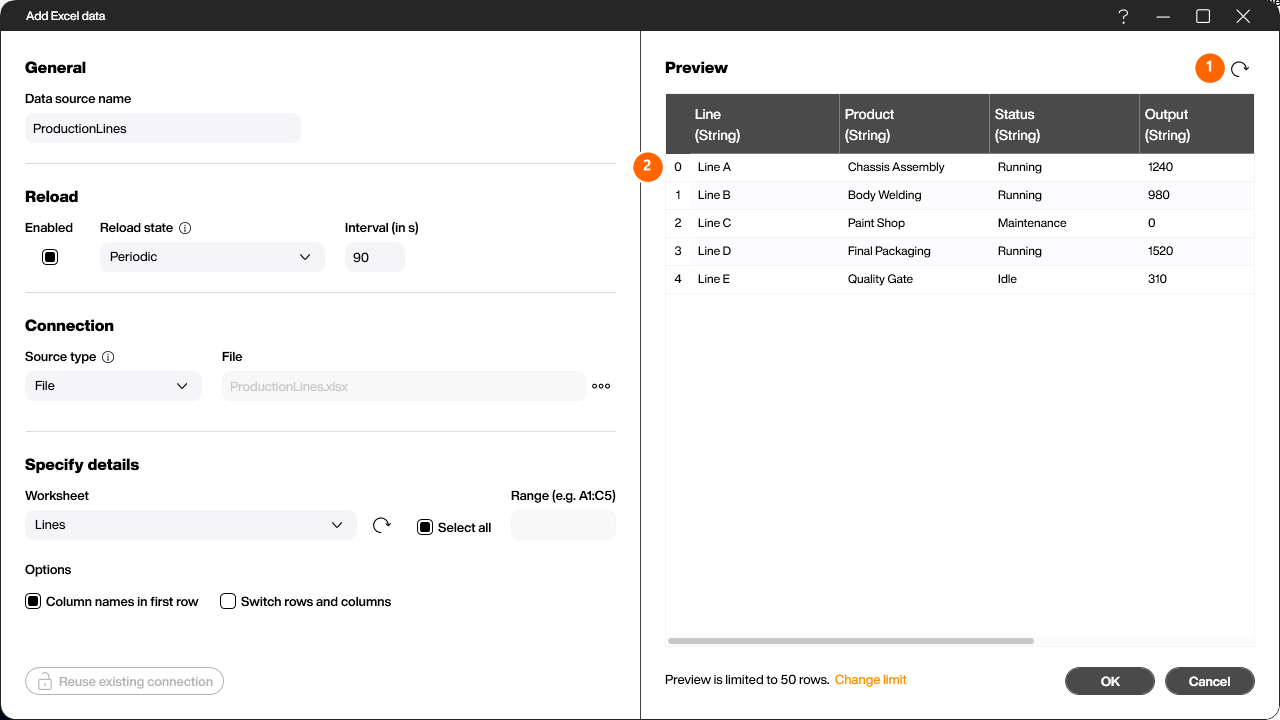
Click on [Load data] (1) to read the file. A preview with the detected columns and the first rows then appears on the right (2). This lets you check straight away whether the correct worksheet was chosen and the headers were recognized correctly.
By default, every column is read in as a string first. You can tell by the “(String)” suffix in the column headers. If you want to convert a column to a numeric type, for example, create a Dataflow and use the [Change column data type] step there.
Use the data source
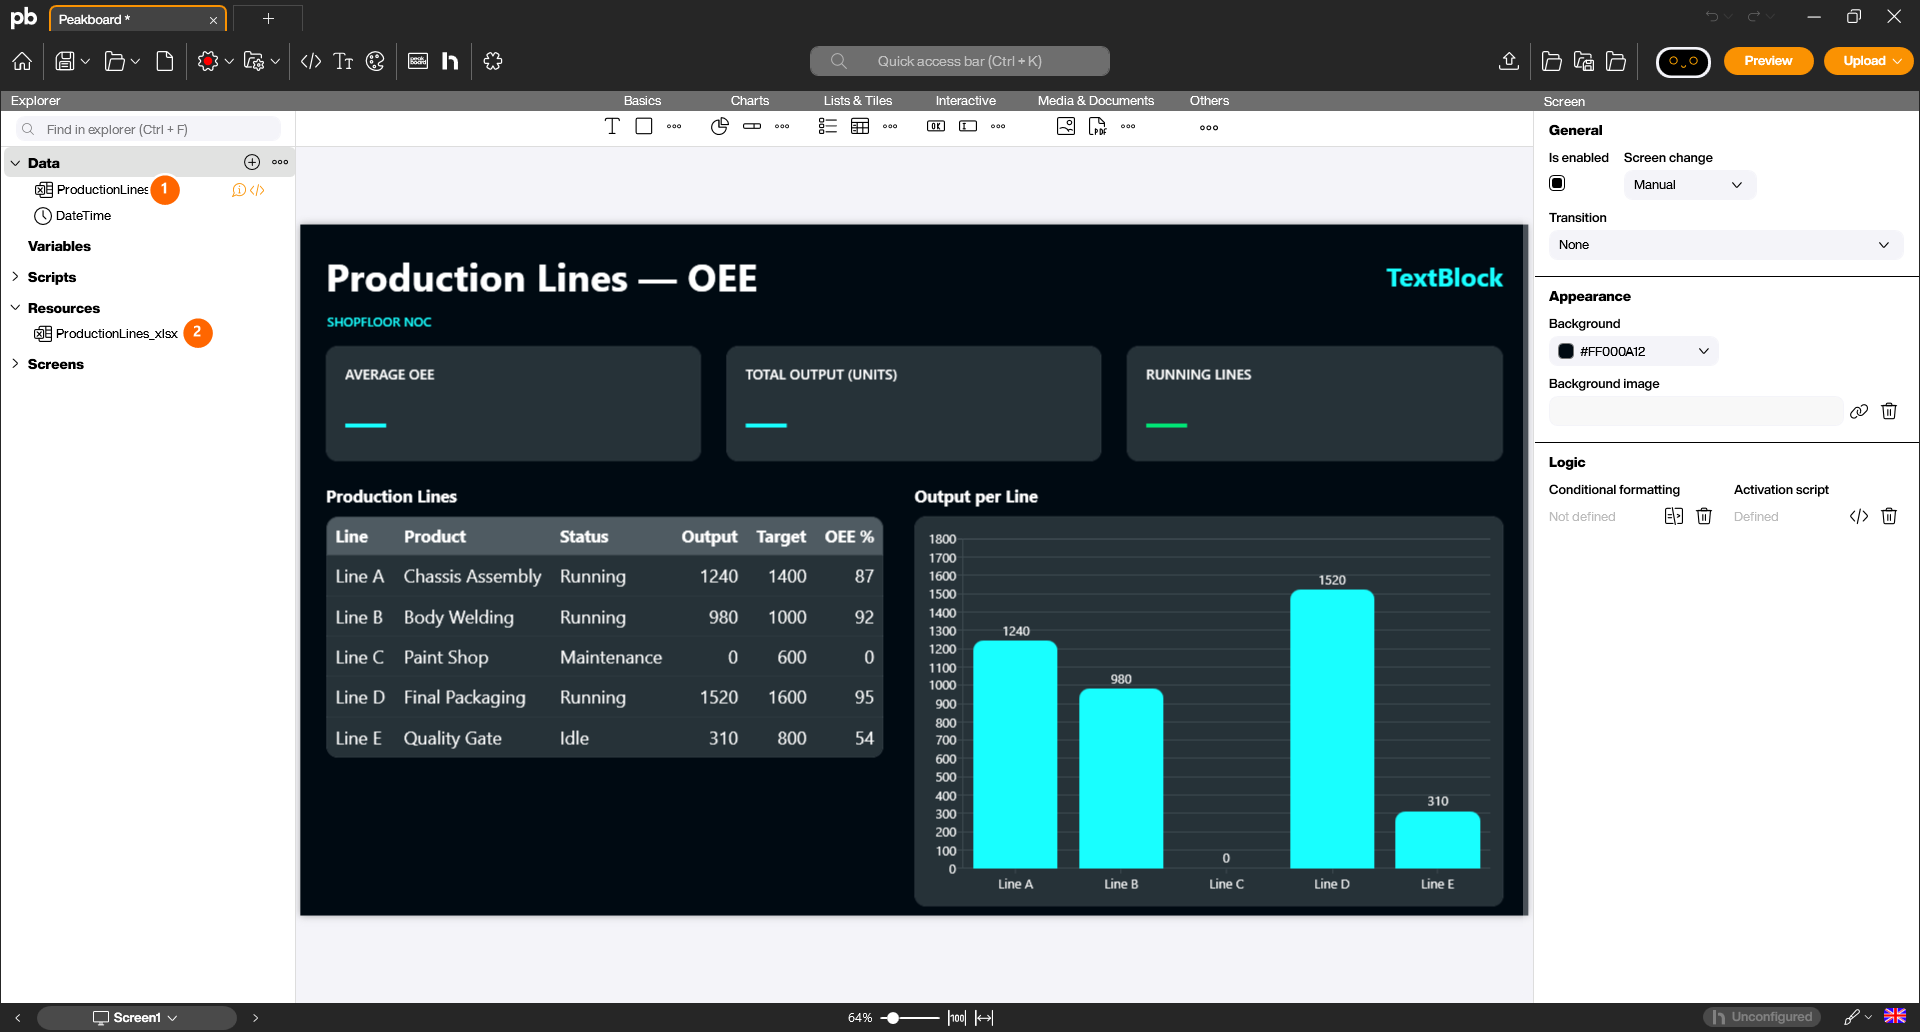
Click on [OK] to create the data source. It then appears in the Explorer under [Data] (1). The file was imported into the project as a resource and can be found under [Resources] (2).
From now on you can link the data source to Controls (for example a Table, a Chart or a Styled List) just like any other and display the Excel data on a dashboard.
Display the data on a dashboard
An Excel data source only becomes useful once you show its data. Link it to a Control – here a [Table] – and the rows from the worksheet appear on your dashboard.
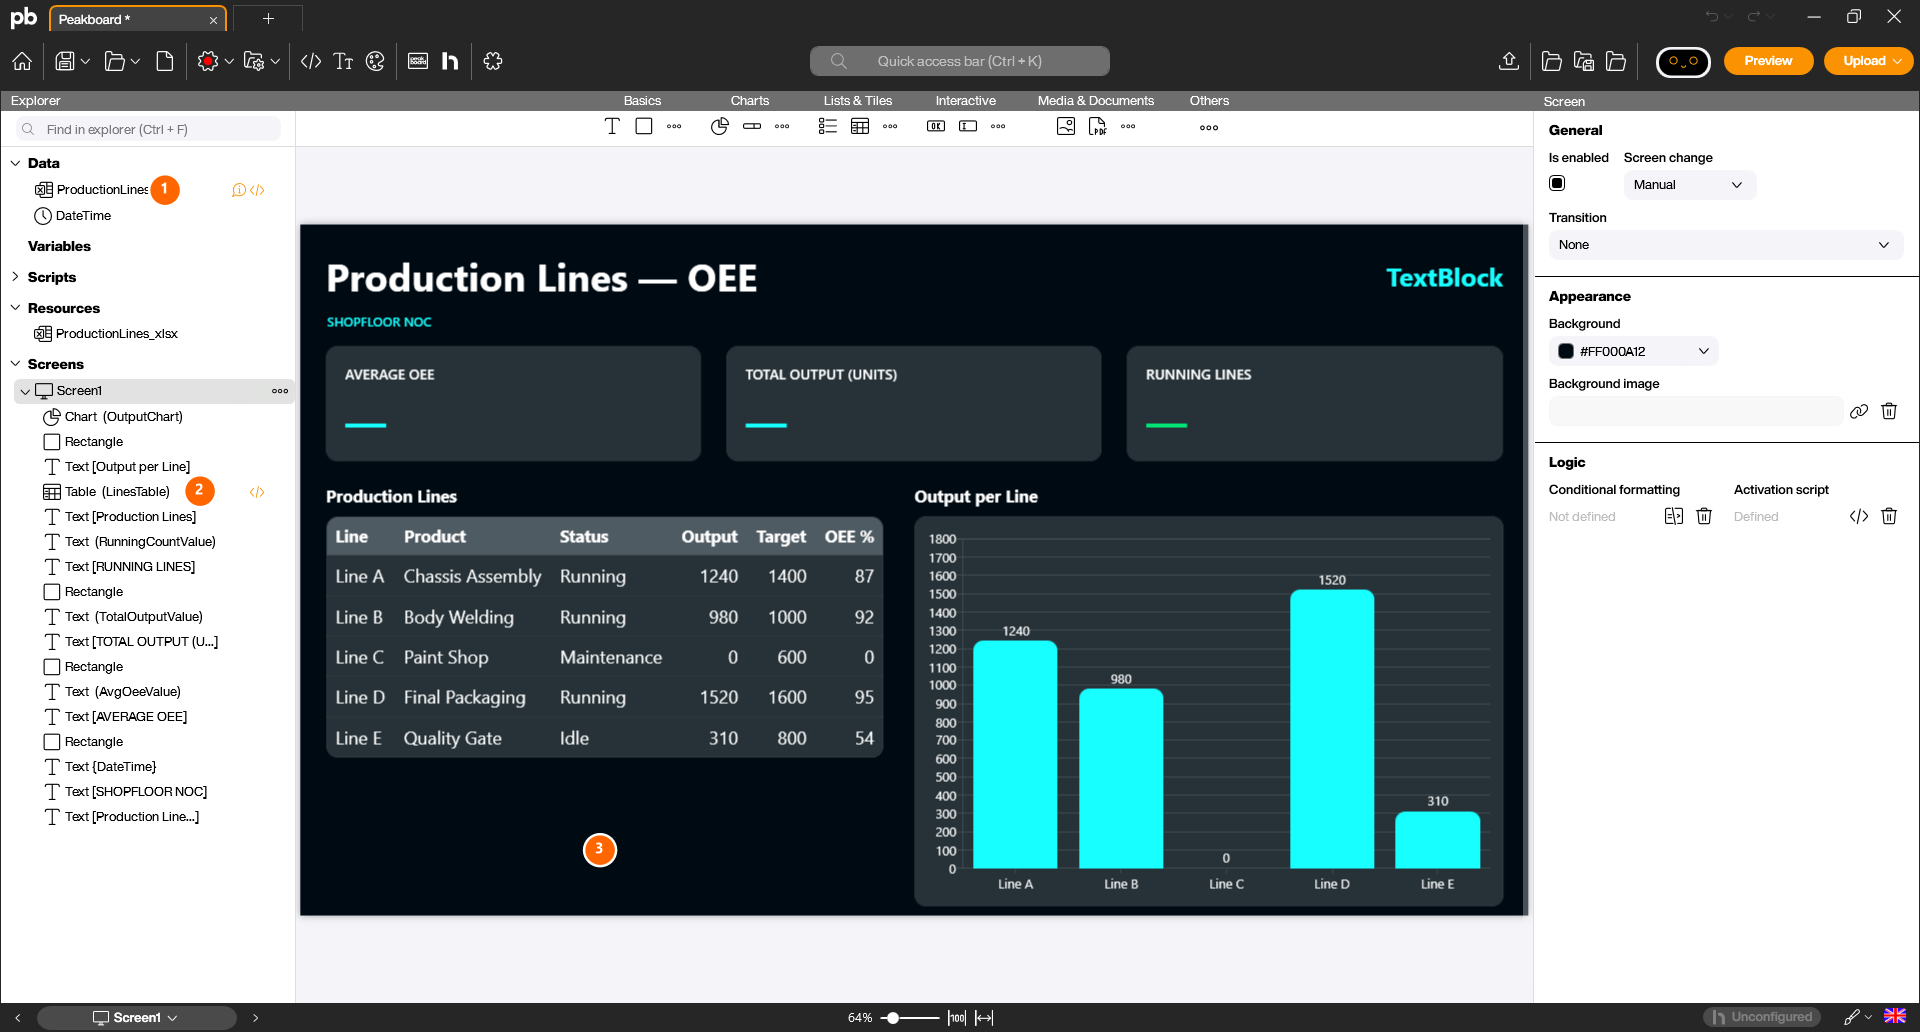
In the example below the [ProductionLines] data source (1) is bound to a Table Control (2). As soon as the binding is set, the Table shows the imported rows directly on the canvas (3).
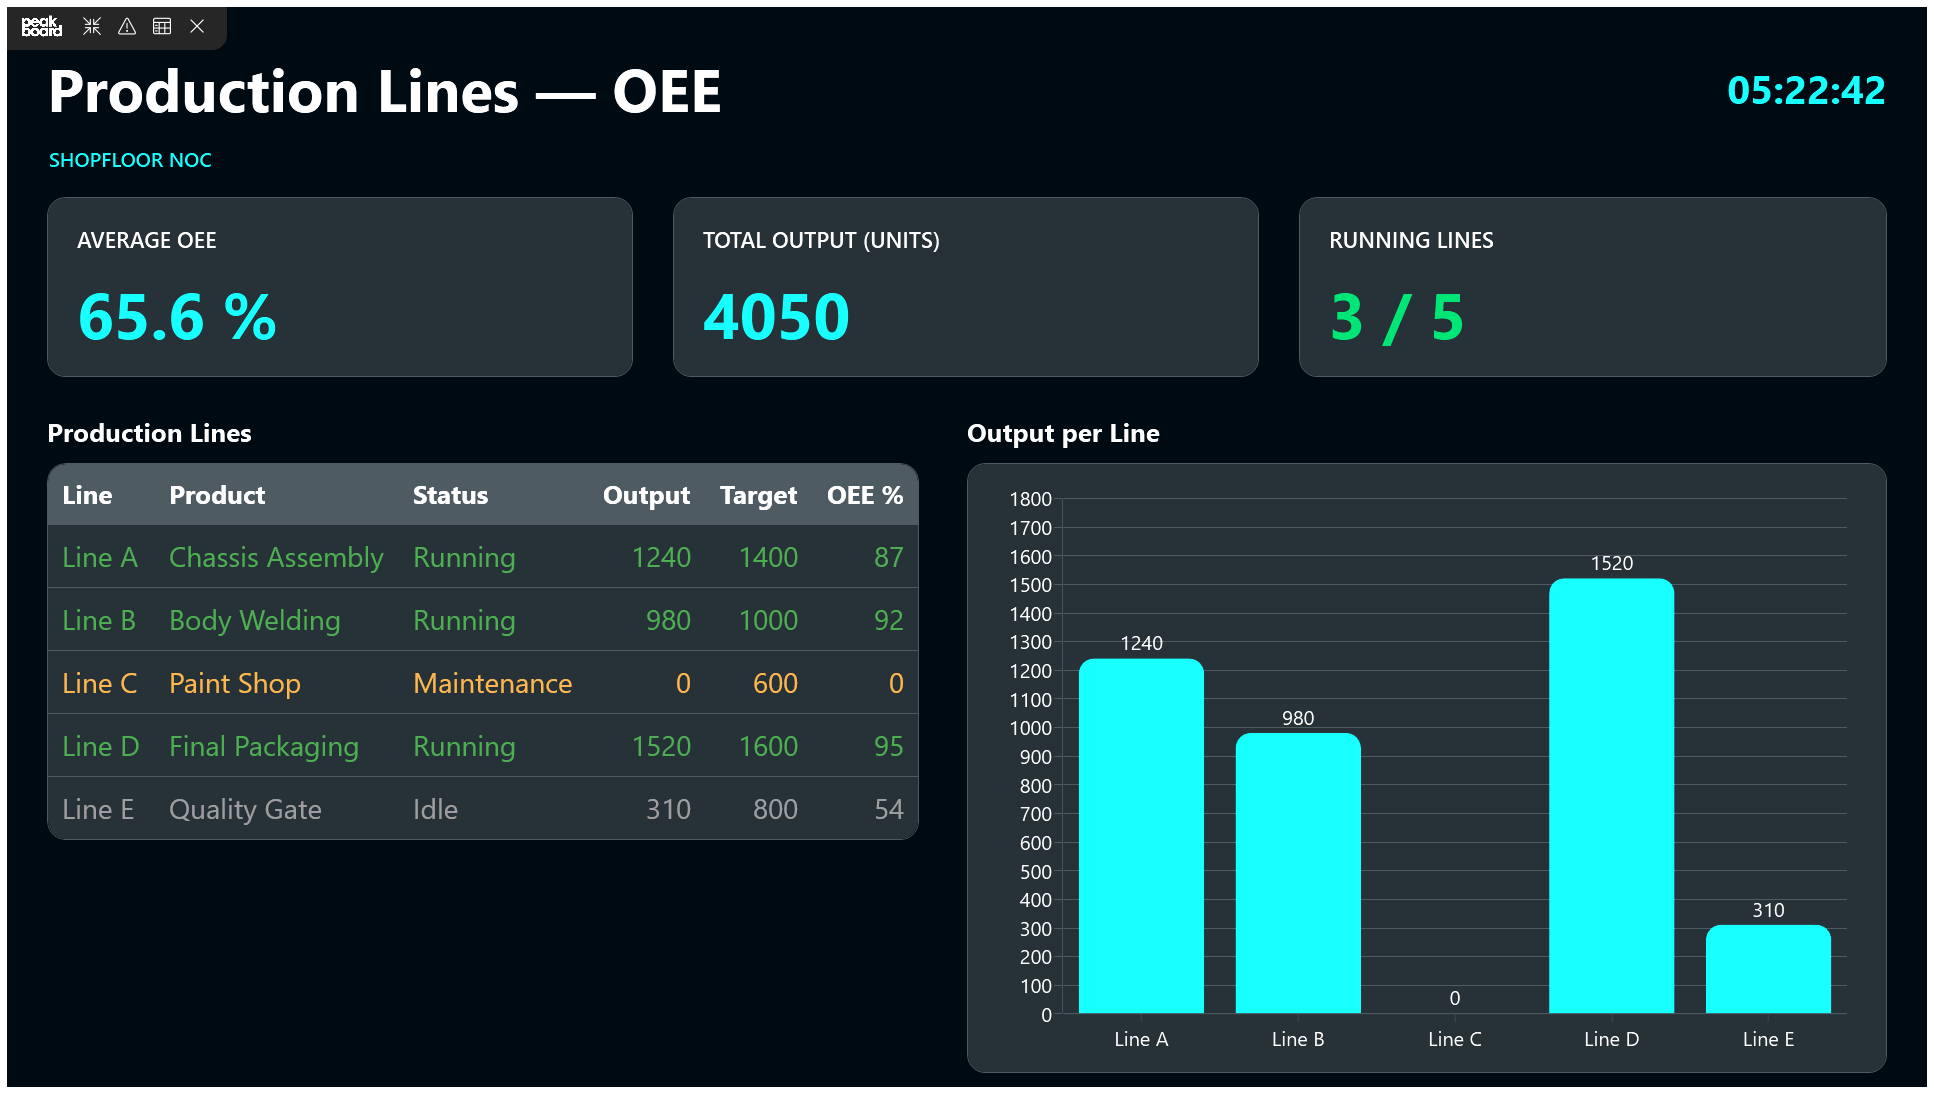
Click [Preview] to run the project in the Peakboard Runtime. The Table, Chart and the key figures at the top now display the Excel data exactly as it will later appear on a Peakboard Box or a BYOD device.
You can download the finished example and open it in the Peakboard Designer to explore the Excel data source, the Table binding and the dashboard layout: Production lines dashboard (.pbmx).