Dataflows
Your first steps with Dataflows
Different data sources communicate with source systems of all kinds and usually deliver the data in the form of a table. To display this data, you either access it by using controls or first use a script to process it. You can learn how to script data or how to manipulate table data in the corresponding articles. In this article, we will show you how to post-process various data using dataflows, even without deep scripting knowledge. With dataflows you can for example:
- Remove unnessecary columns and rename columns.
- Change column data type.
- Add new columns and fill them with content created by a logic defined in a script.
- Link multiple data sources, even from different source systems, using joins and combine them into a single table.
Dataflows allow you to start from a single table and adjust the dataset step by step until the result is what you need. You can view, change and add to the individual steps for each dataflow in the Peakboard Designer. This way you can easily check if the sequence has the desired effect and if the result appears.
Create a new dataflow
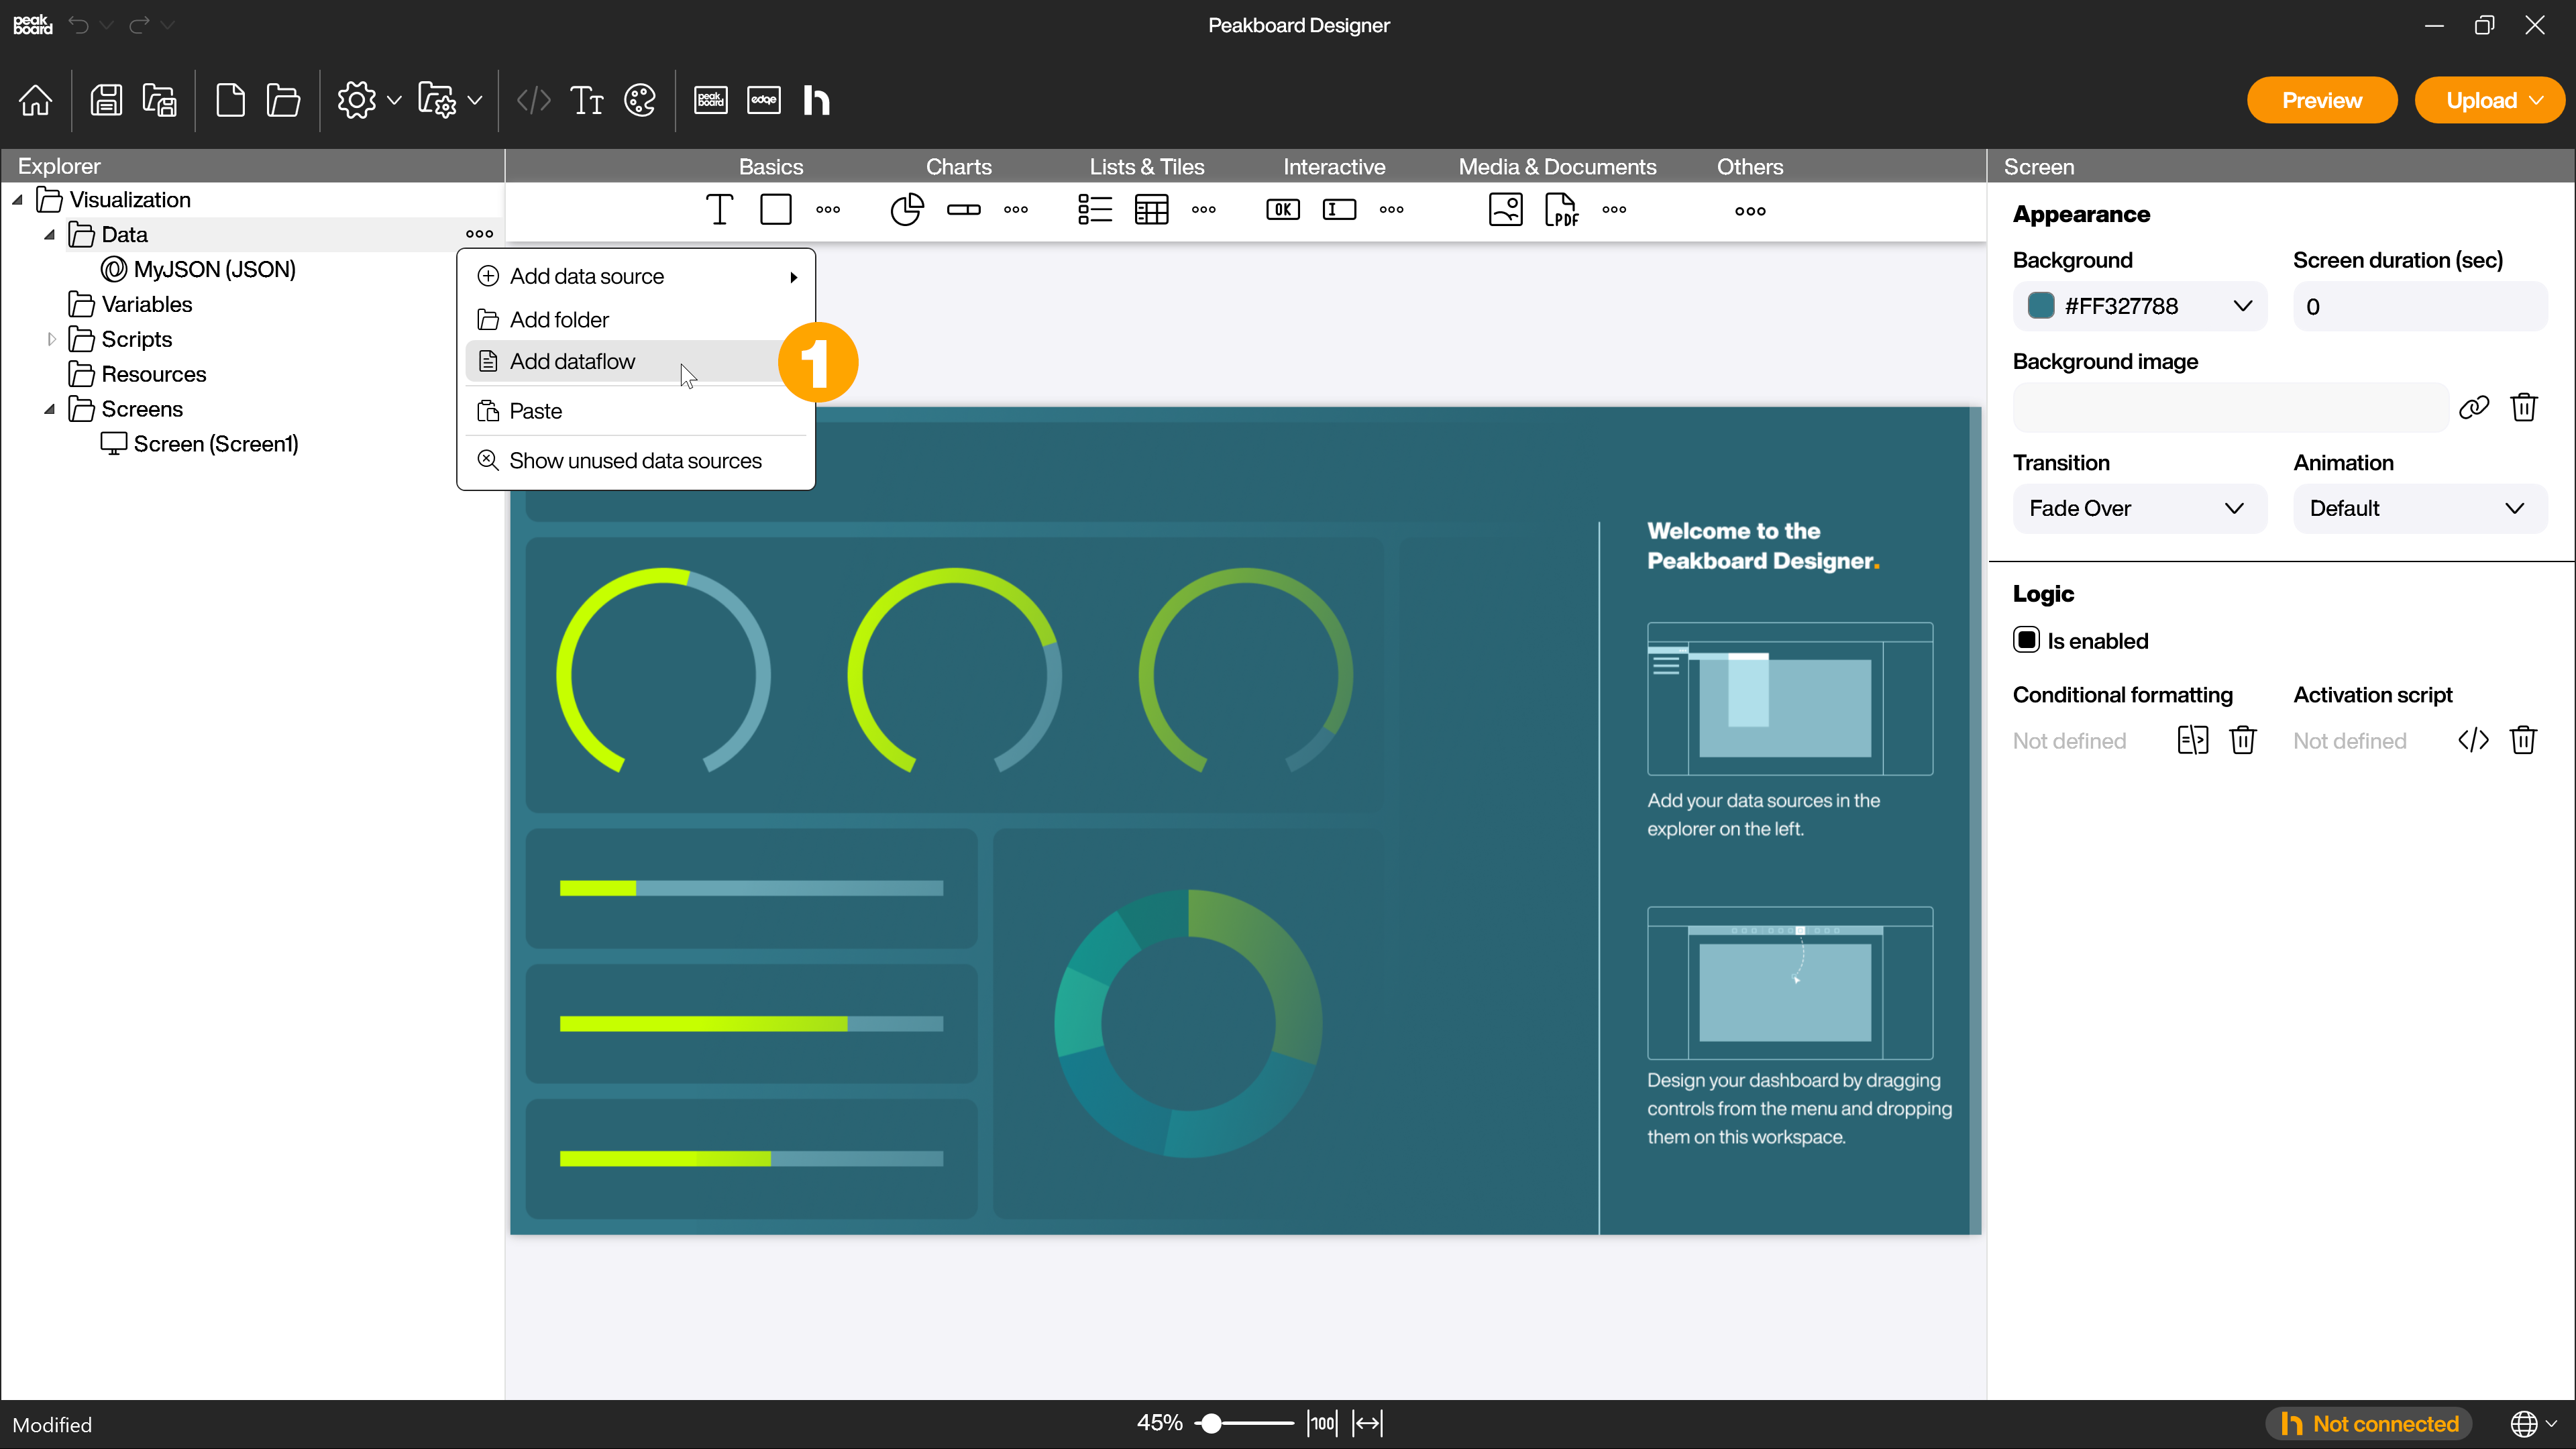
To create a new dataflow, click on […] next to [Data] or right click on it and select [Add dataflow] (1).
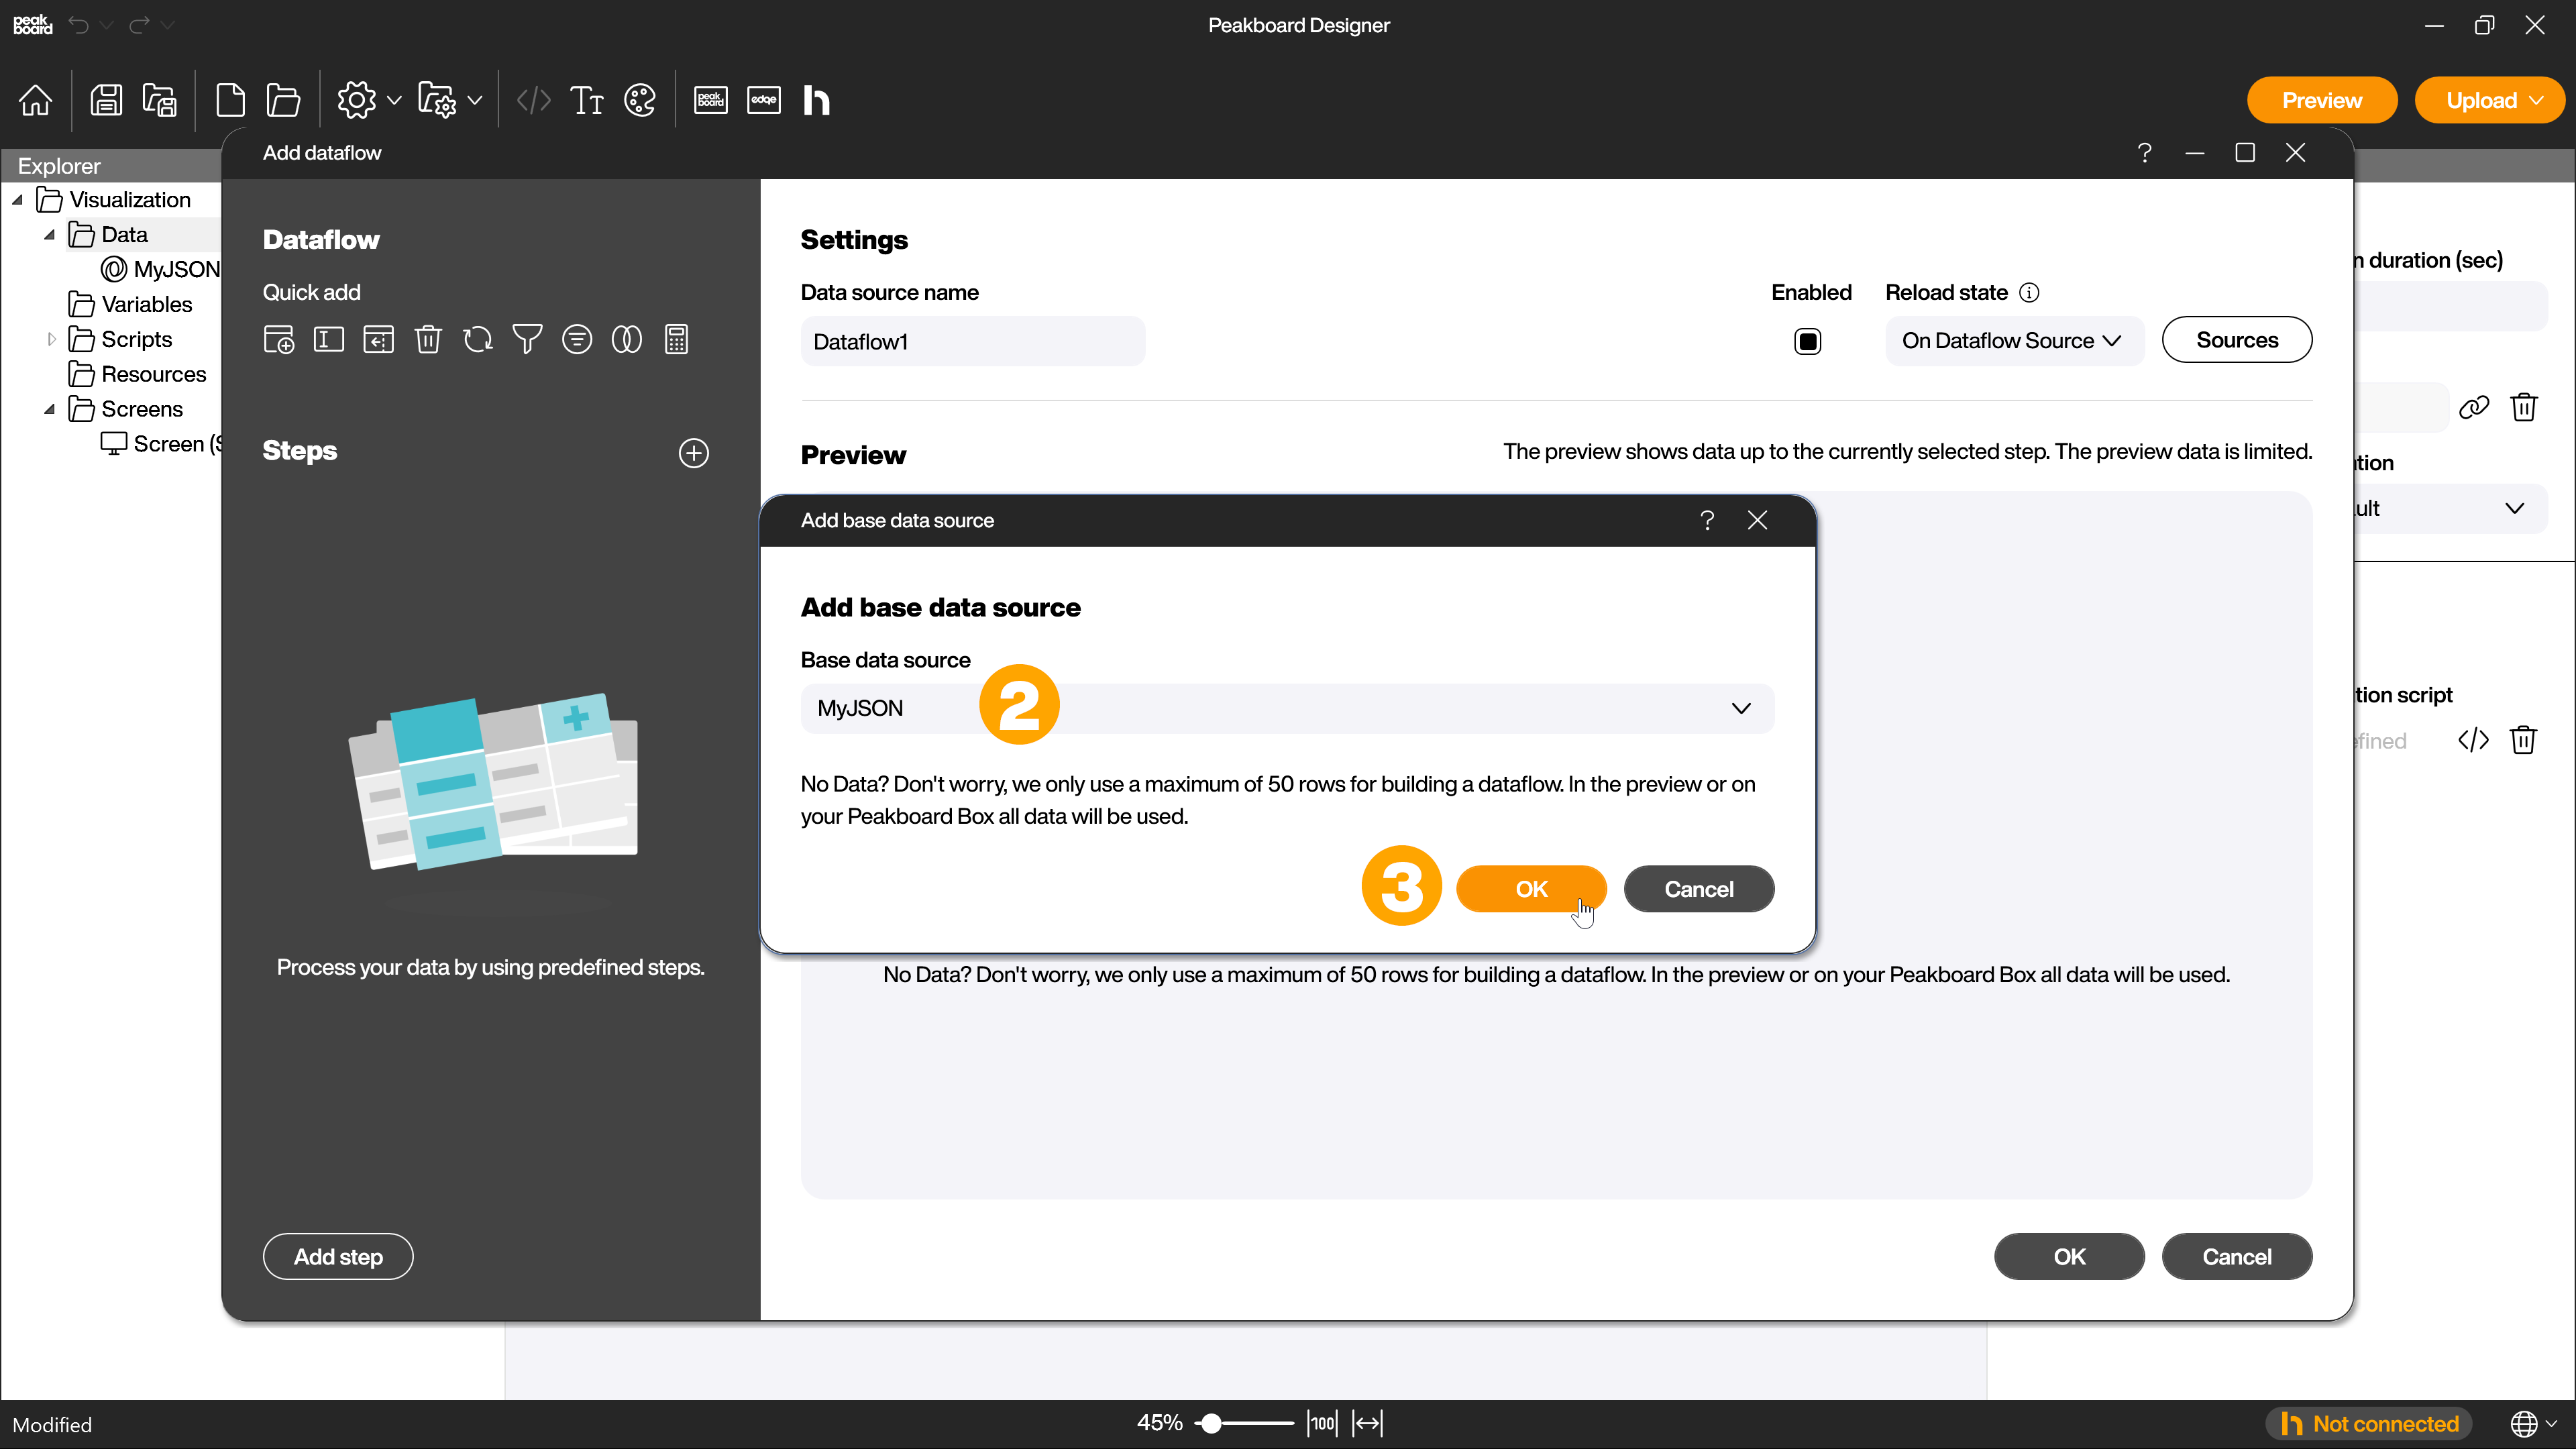
Now you have to select your base table (2) and confirm with [OK] (3).
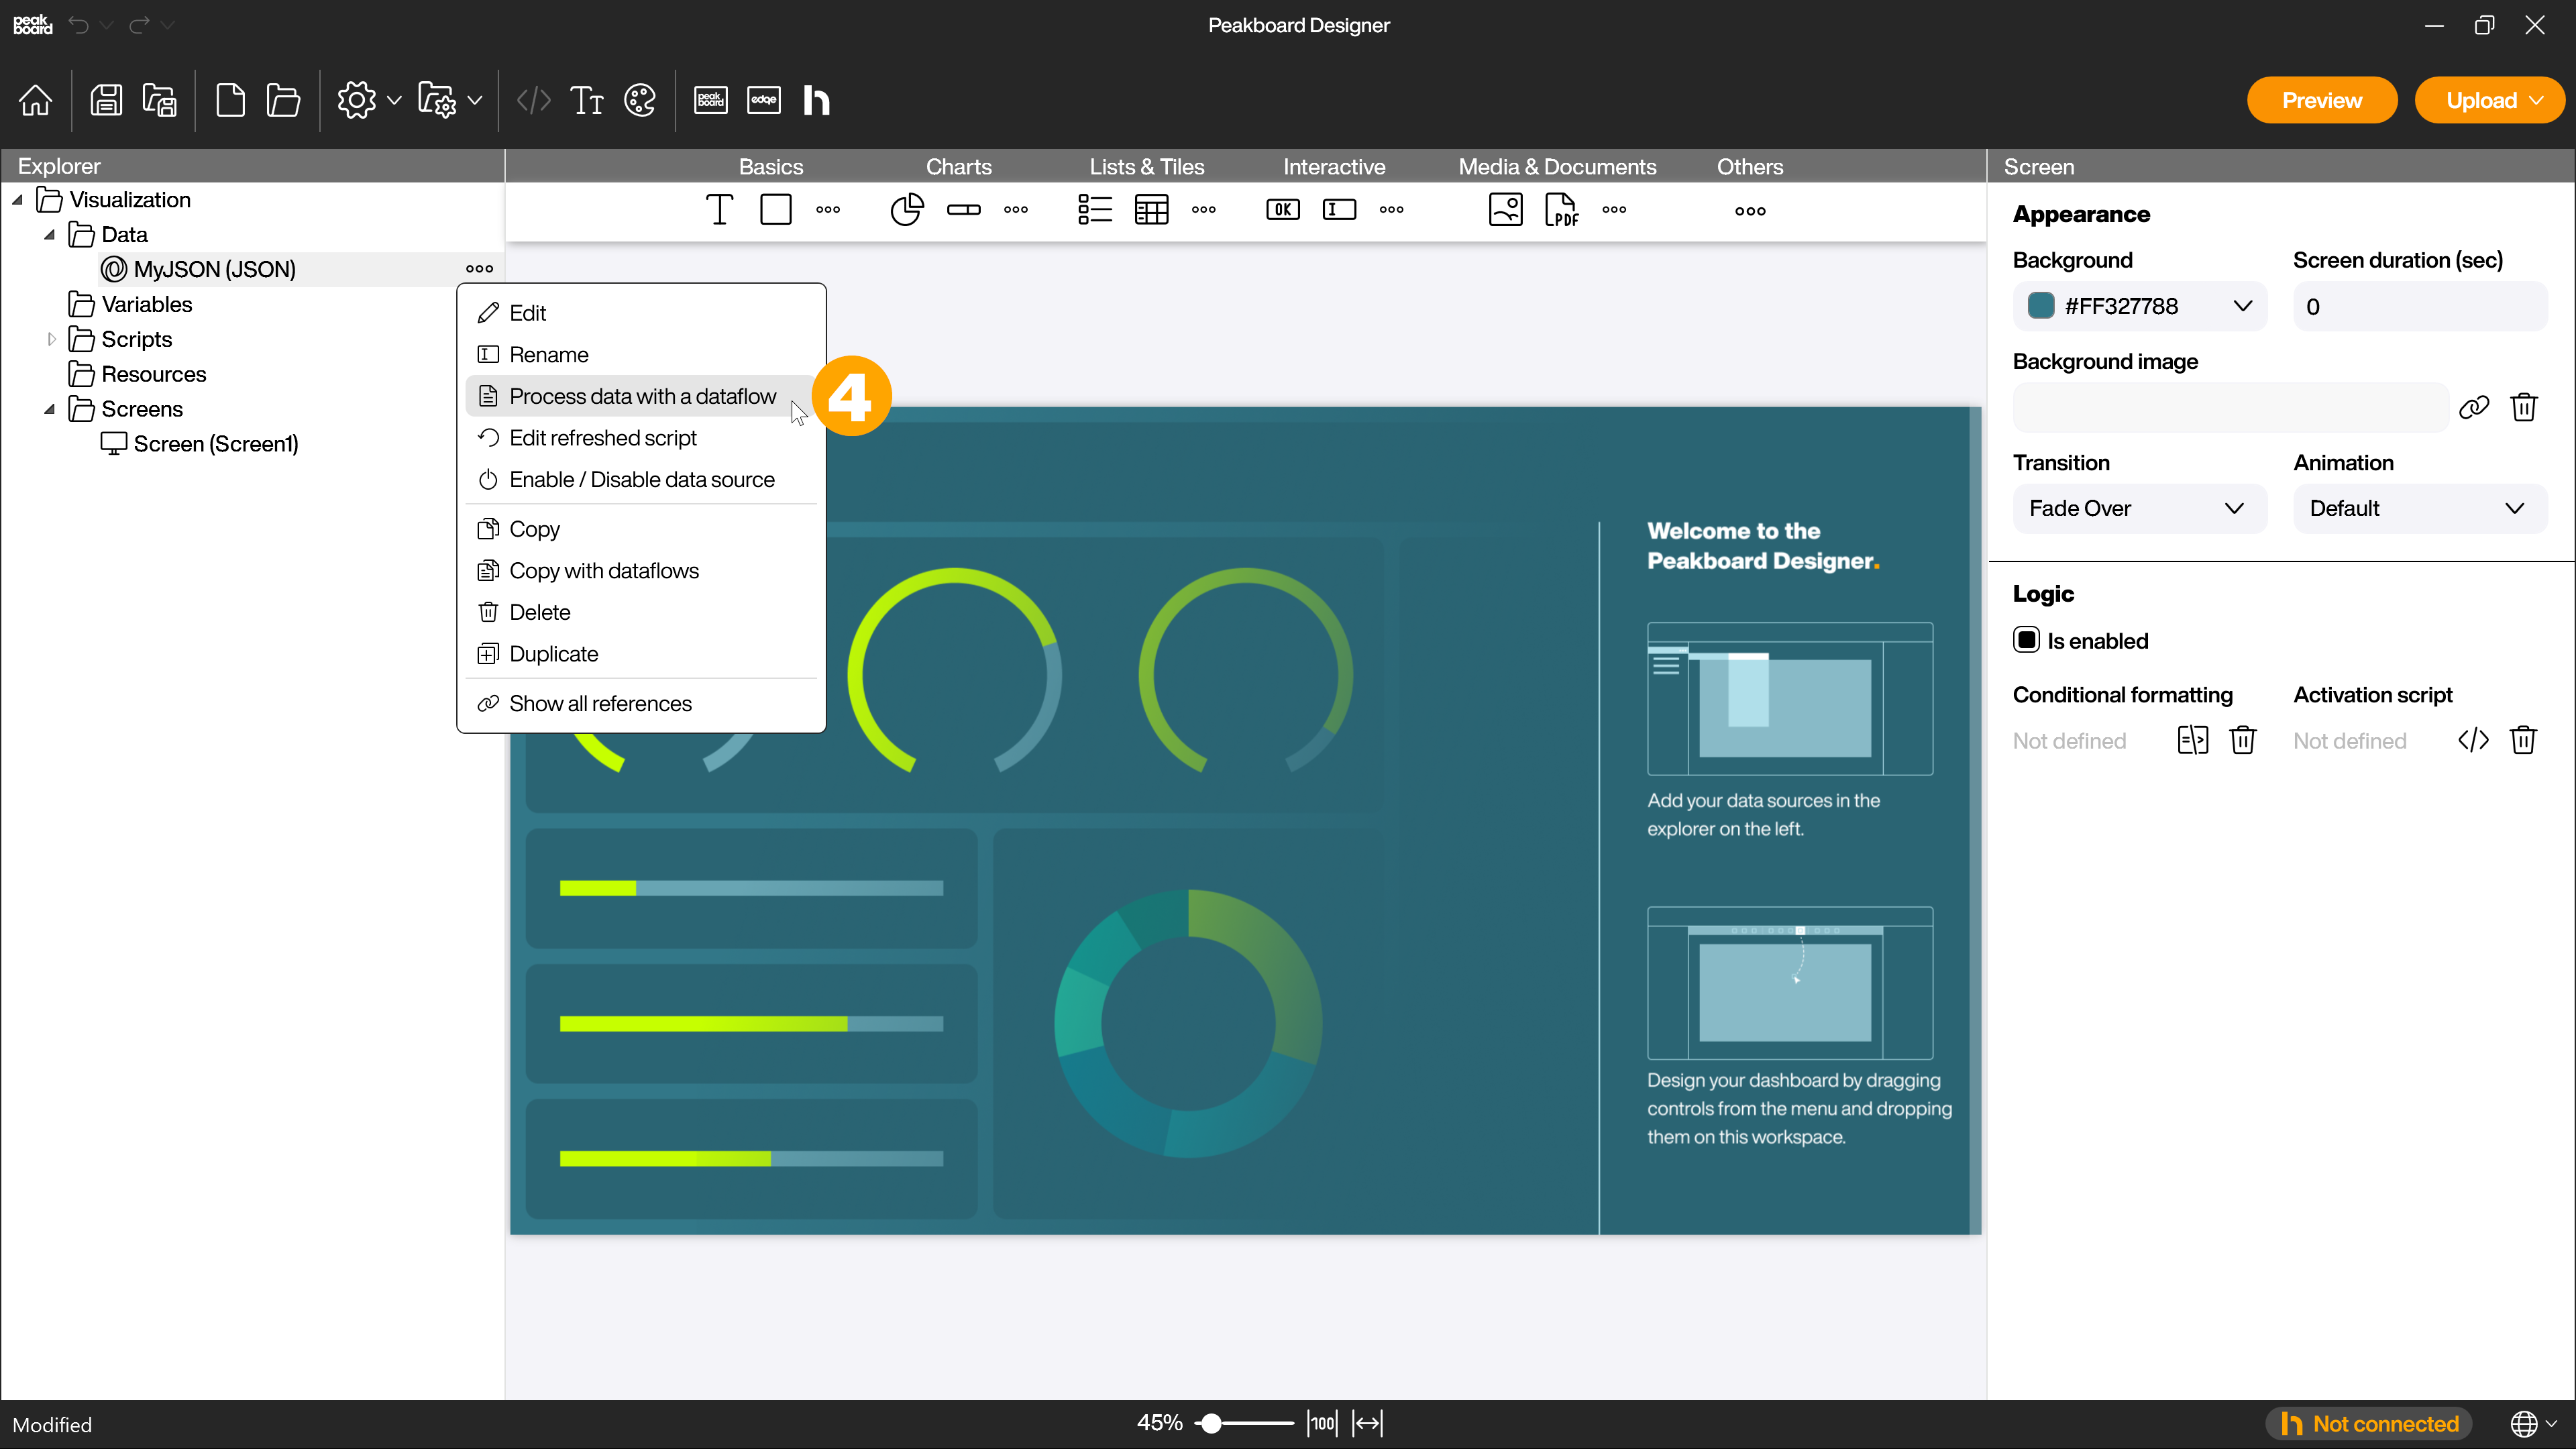
This step is skipped if you click on […] next to the data source you want to use as base table to create the dataflow or right click on it and select [Process data with a dataflow] (4).
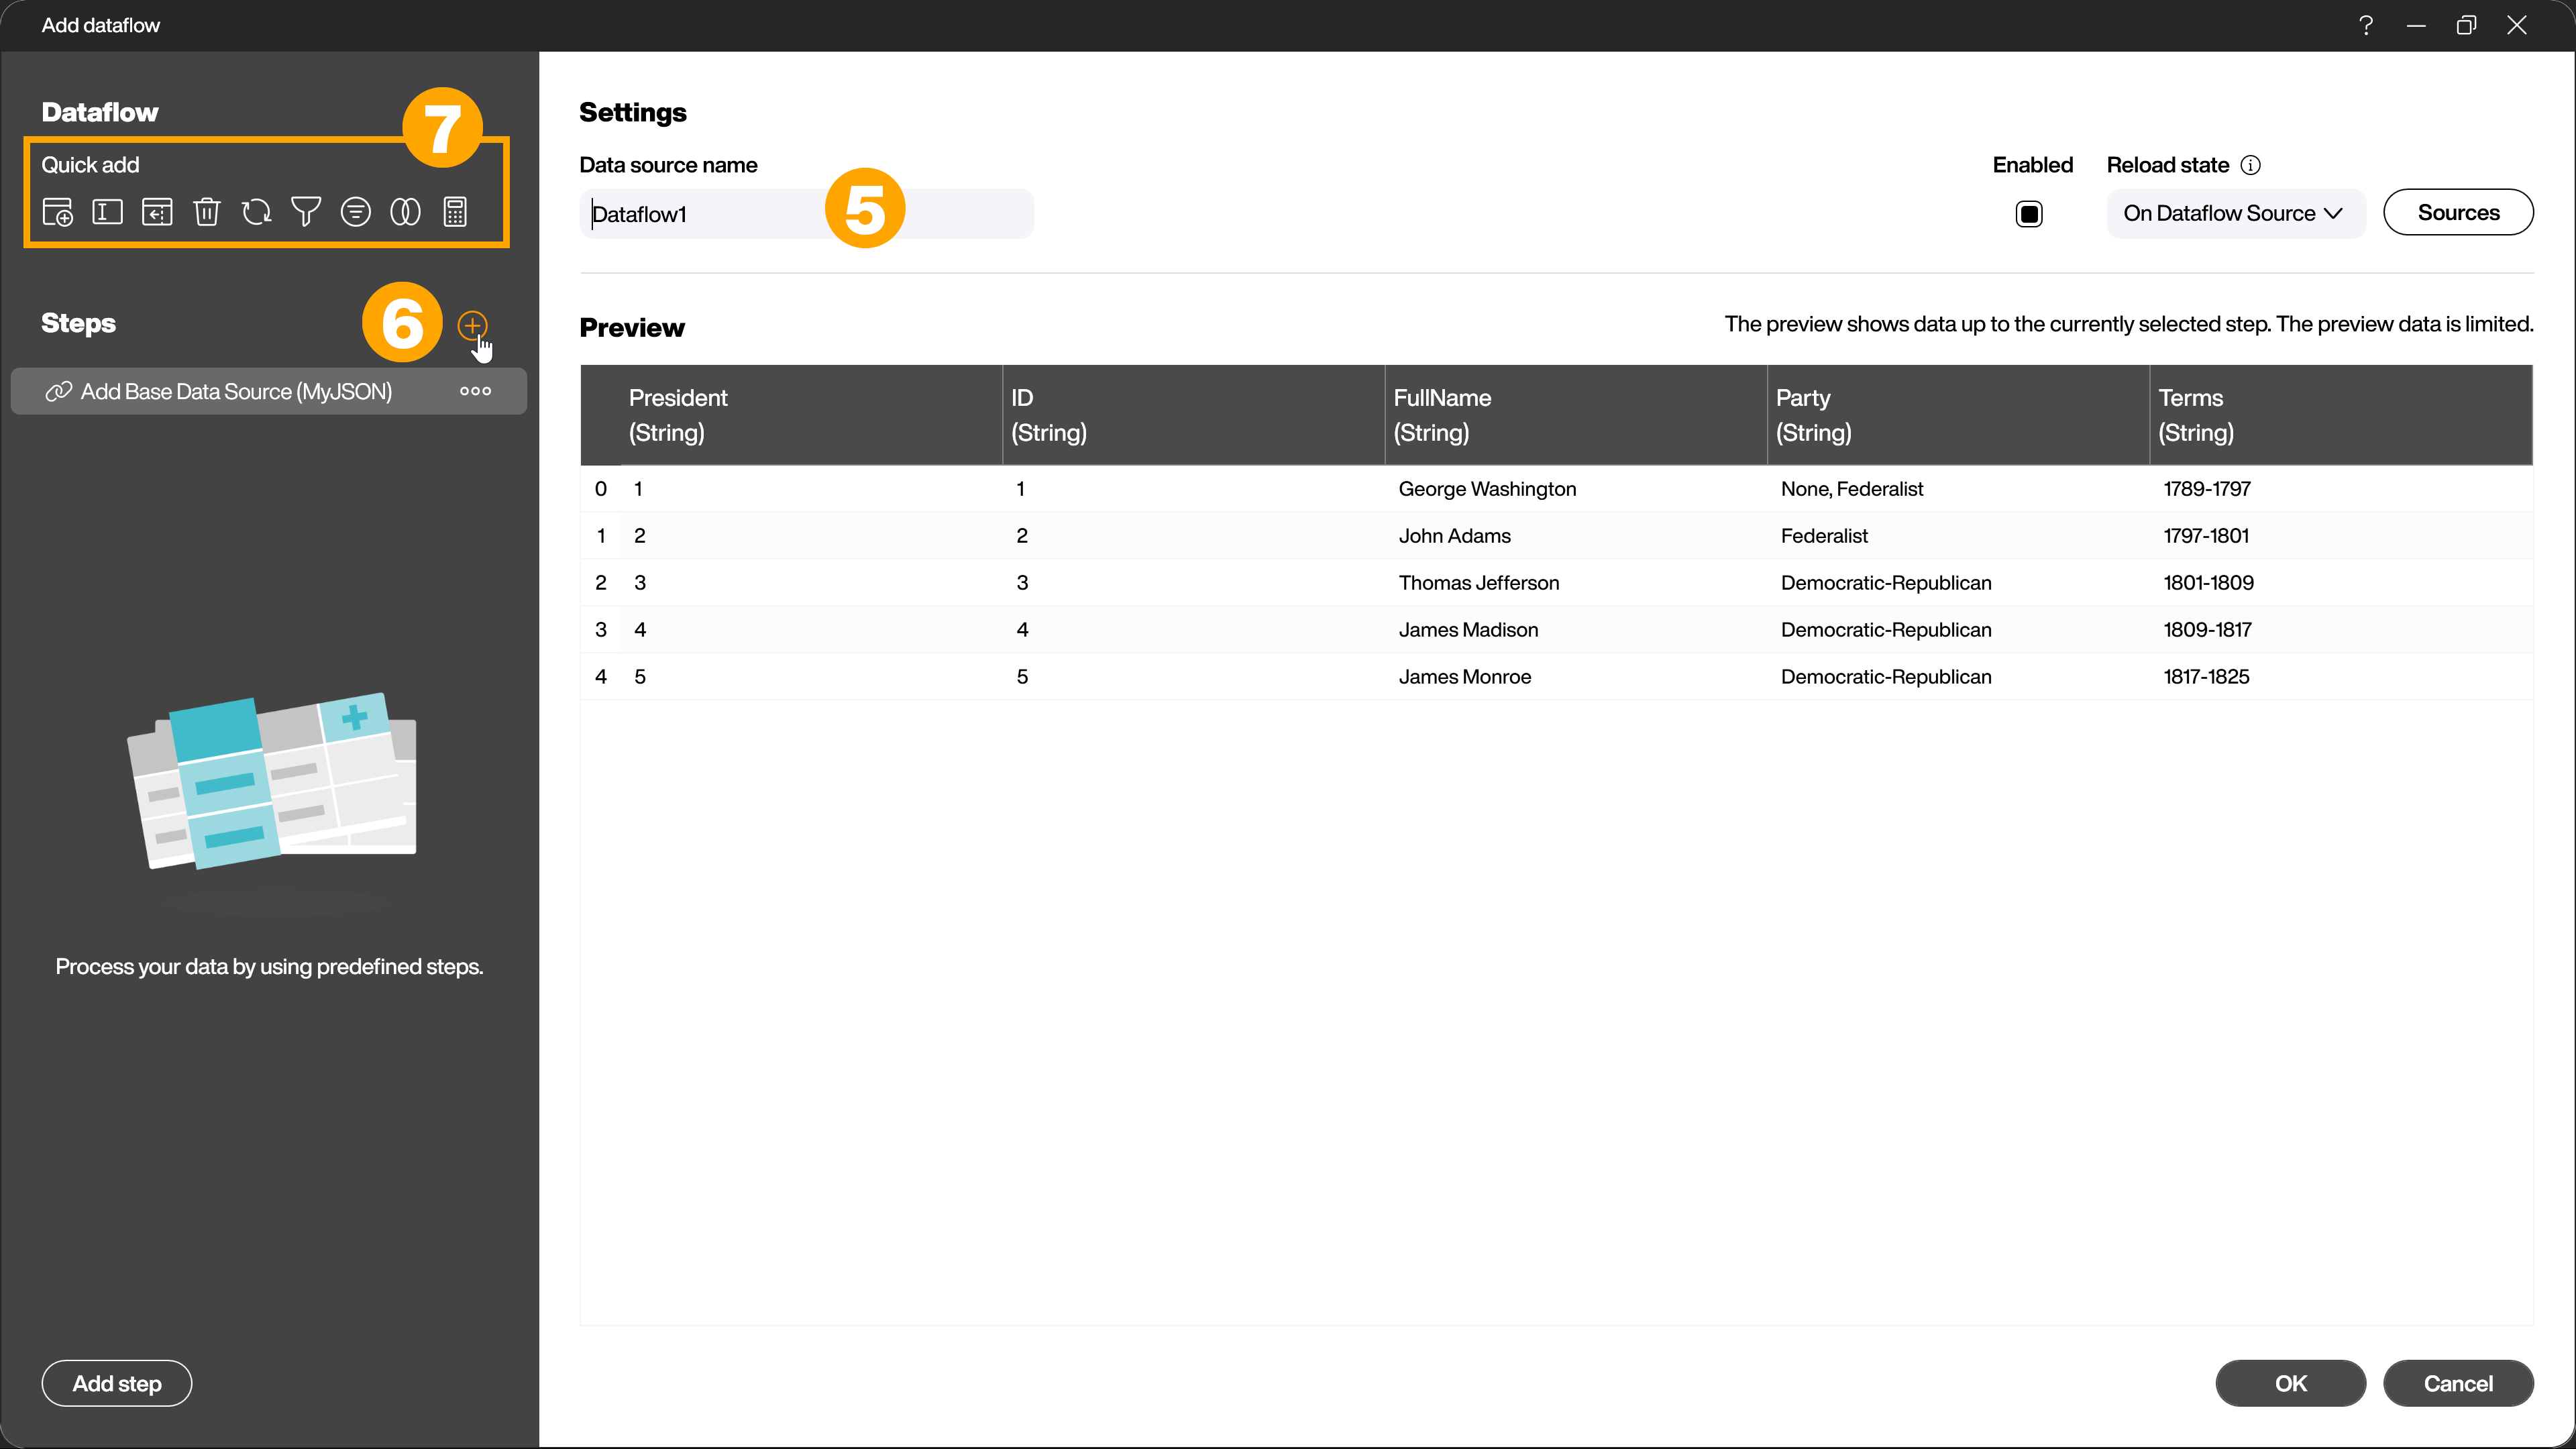
Even if several tables are involved in the data transformation at the end, the dataflow always starts with exactly one table. In the text field (5) you assign a unique name for easier identification of the dataflow. Using the [+] symbol (6) you can now apply further transformation steps to the table. There are also some frequently used steps available for quick selection (7).
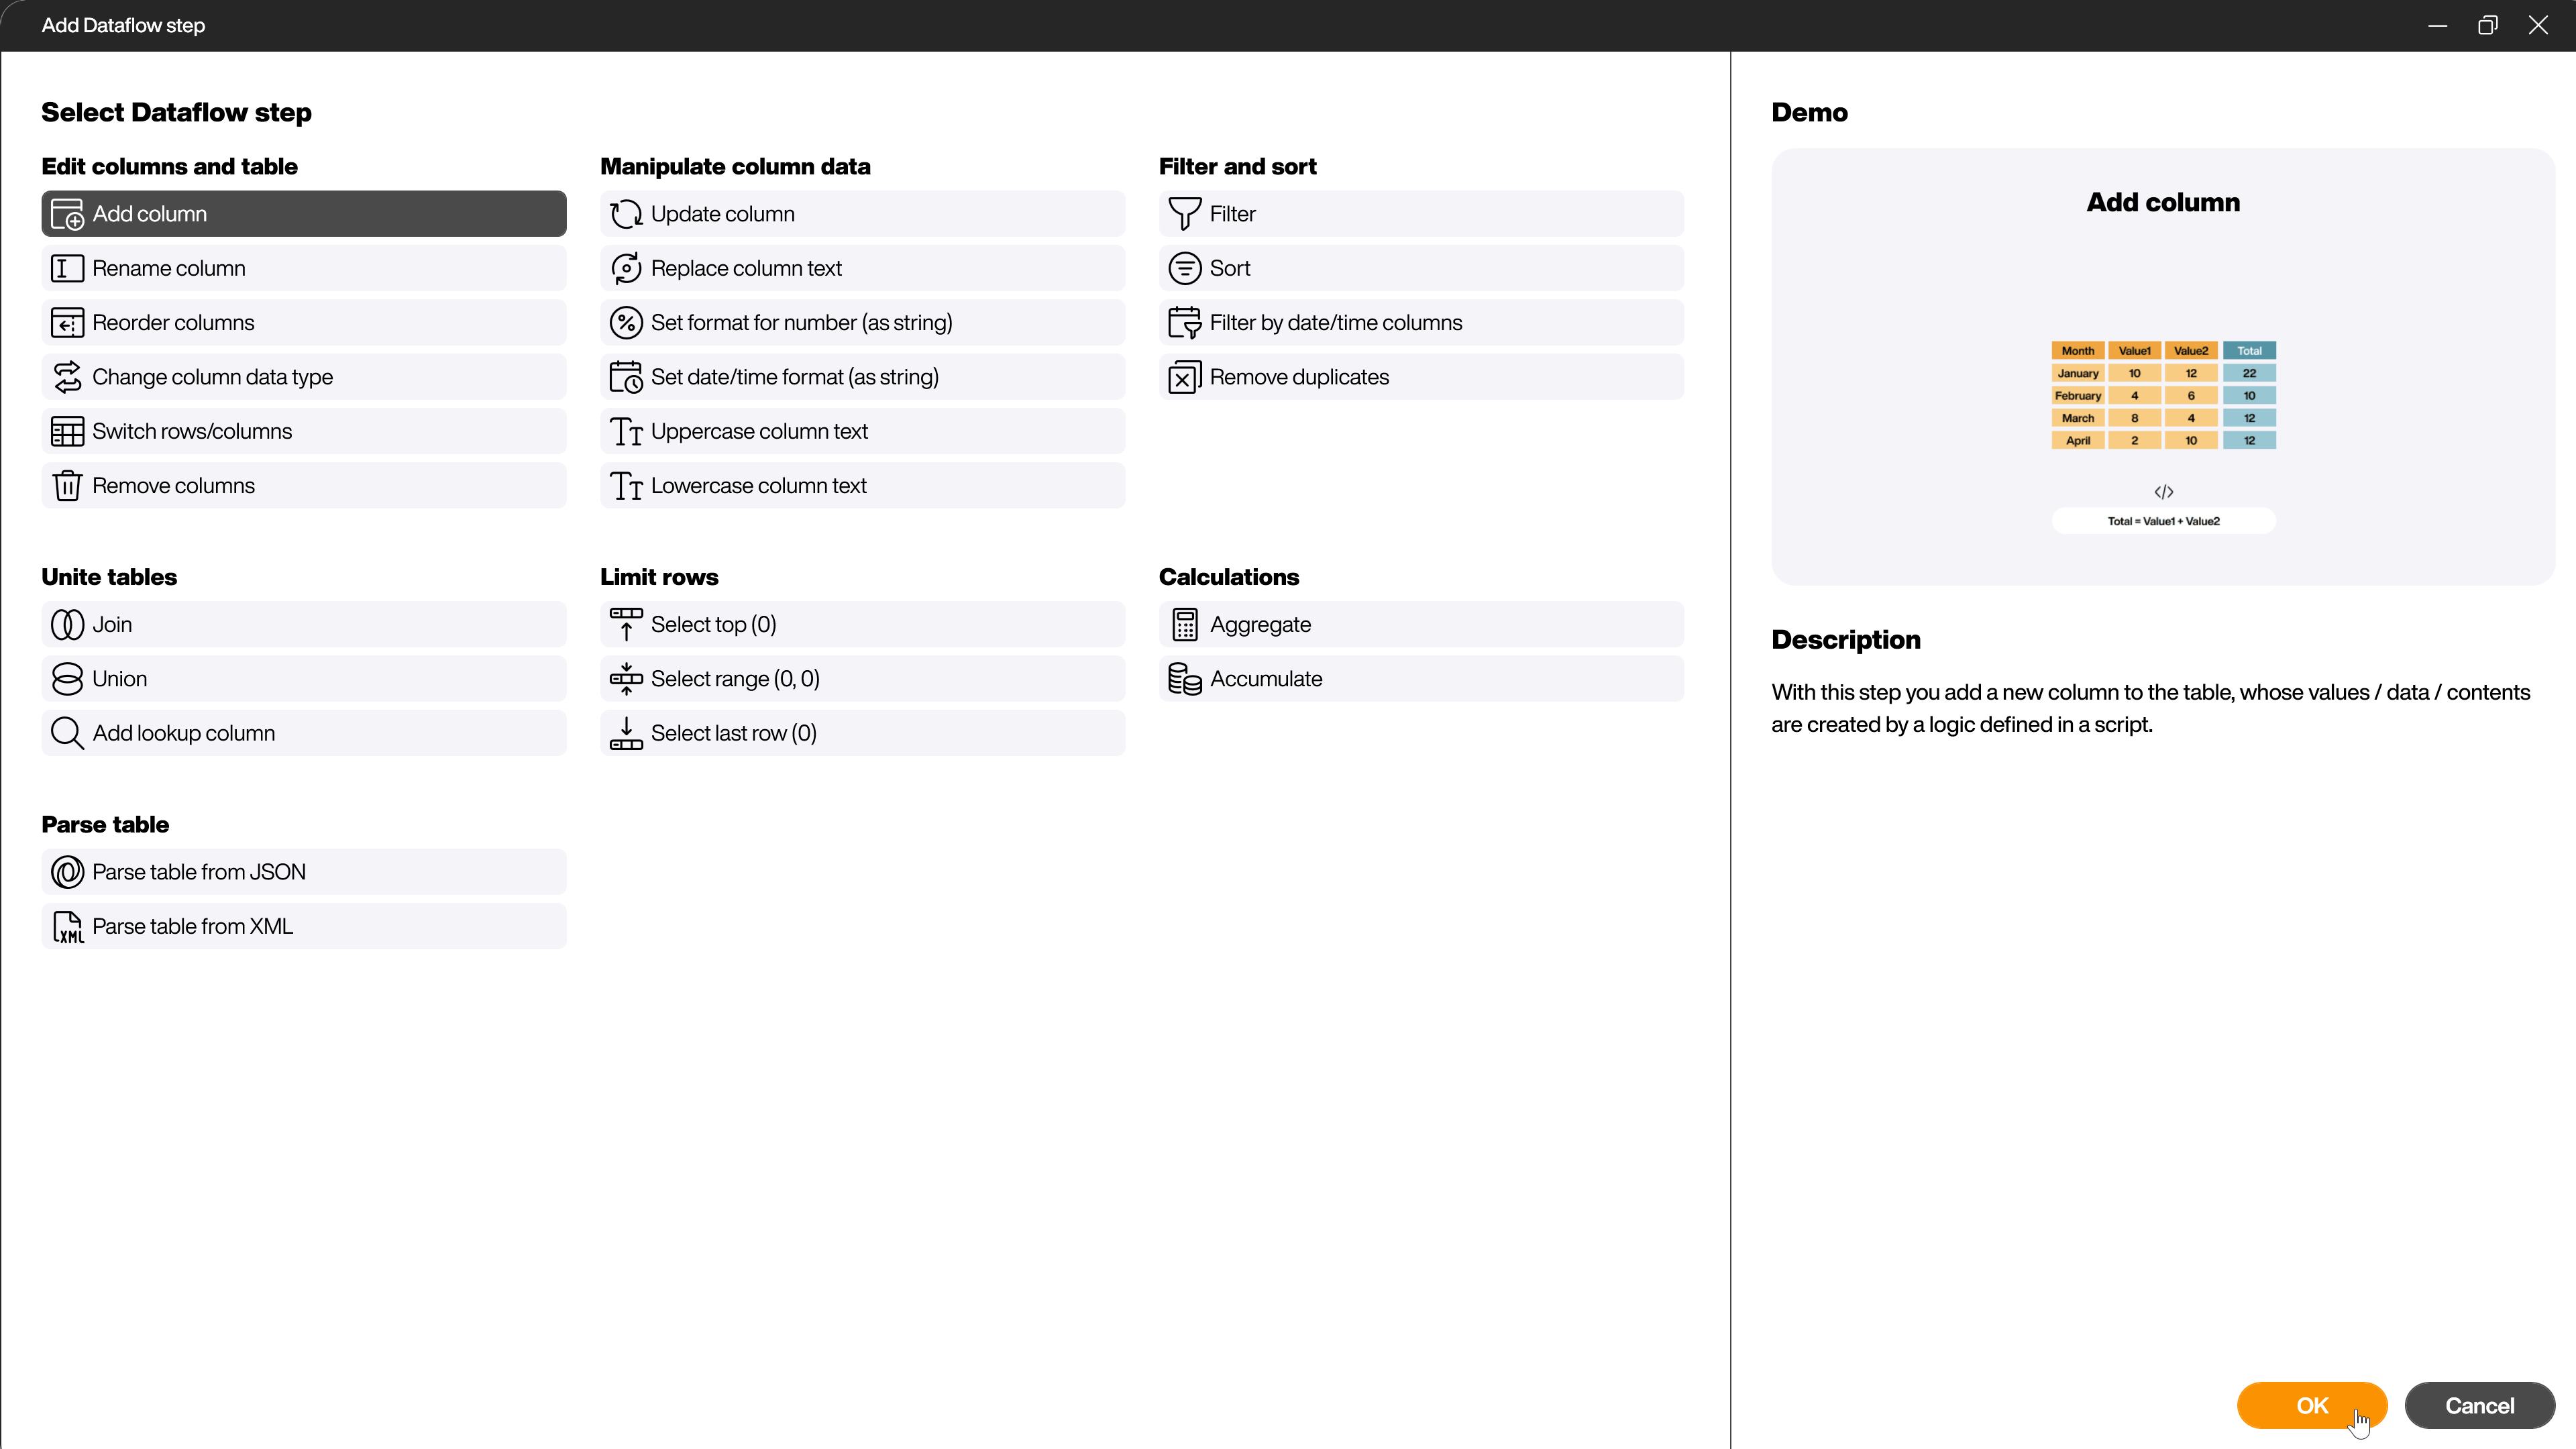
In the selection dialog that opens, you can see all available steps. If you click on one of the steps, more information about the step will be shown to make the selection of the right step as easy as possible.
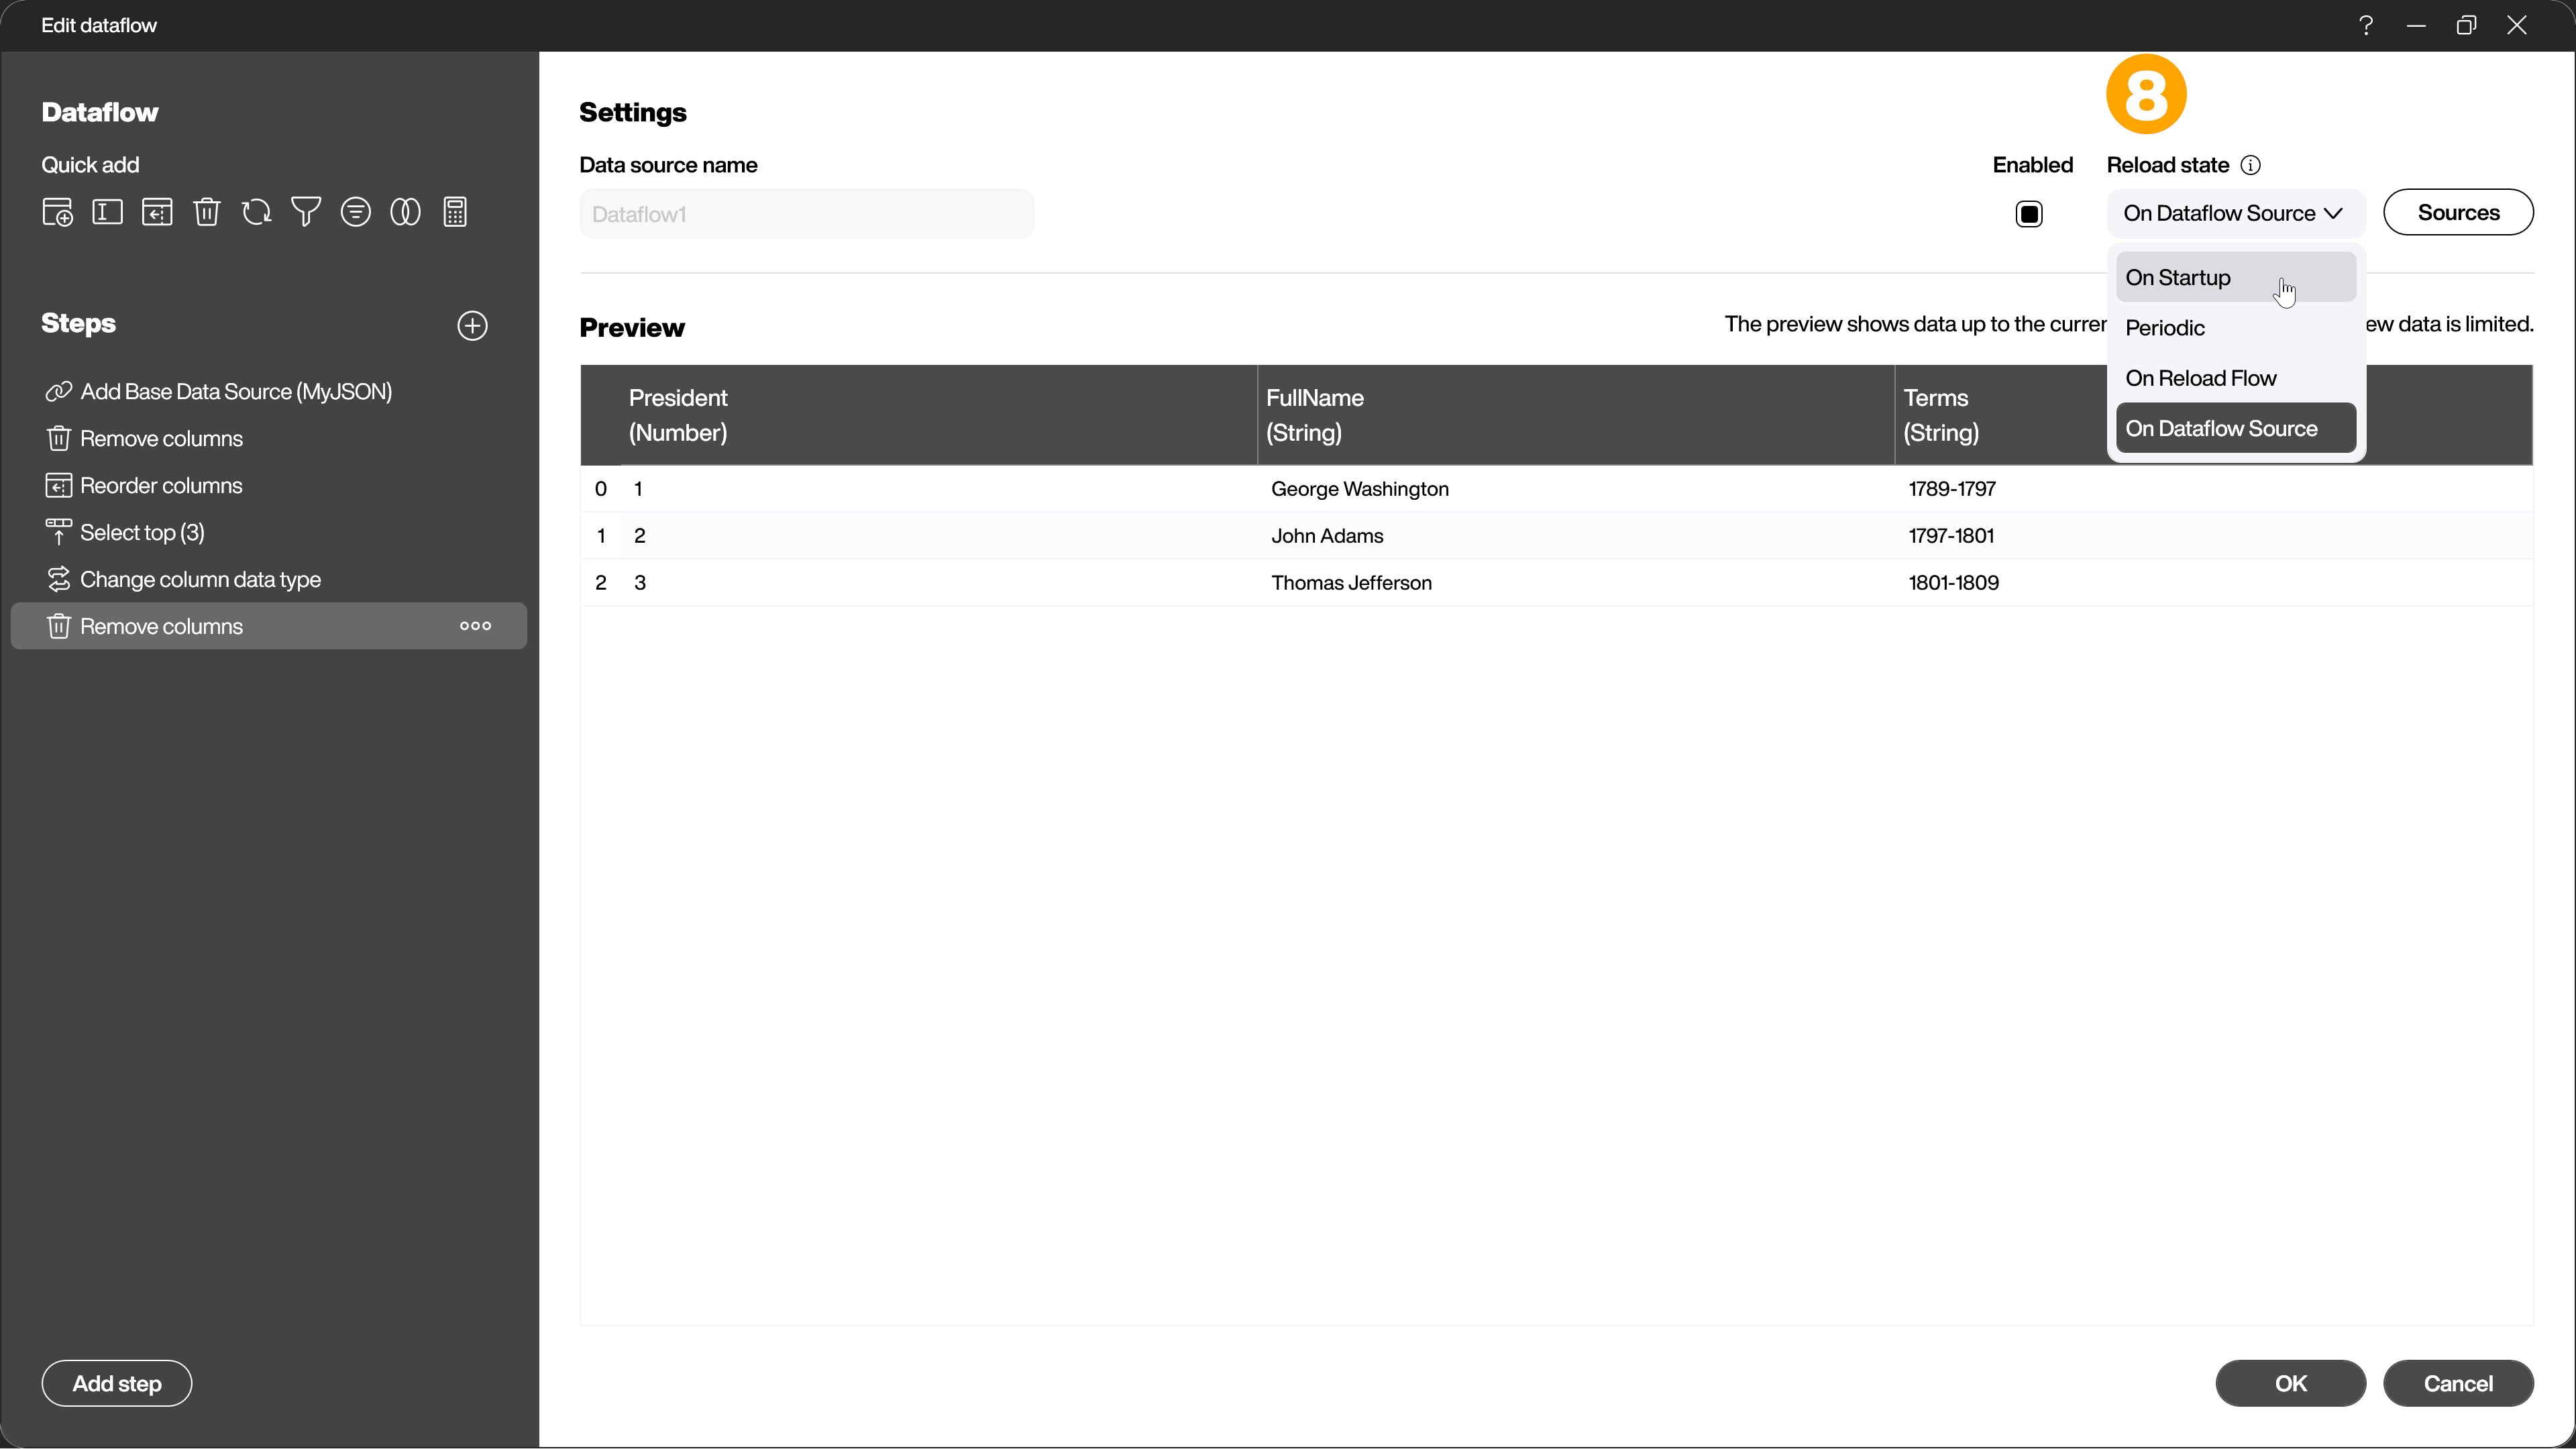
In the left part of the dialog, all steps already applied are listed. You can change or delete them later. You can rename the steps at any time and also change their order later. You can also deactivate or reactivate individual steps. Click on one of the steps and let the dialog area on the right show you the state of the data AFTER this step.
Another alternative to adding the steps via the selection dialog is to use the context menu directly in the data preview. By right-clicking on the area you want to change, you will see the appropriate steps for this area.
Finally, under [Reload state] you can set whether the dataflow should be updated at the start of the visualization, at a chosen interval, from a reload flow or together with its source (8).