Data sources
Microsoft Graph API Extension
To use the Microsoft Graph API Extension data source, the following minimum requirements are necessary:
- Microsoft account and valid Office 365 license including Microsoft Graph.
- Microsoft Azure account
To get started, you must first register an app in Microsoft Azure.
Register an app to enable communication between Peakboard and Microsoft Graph
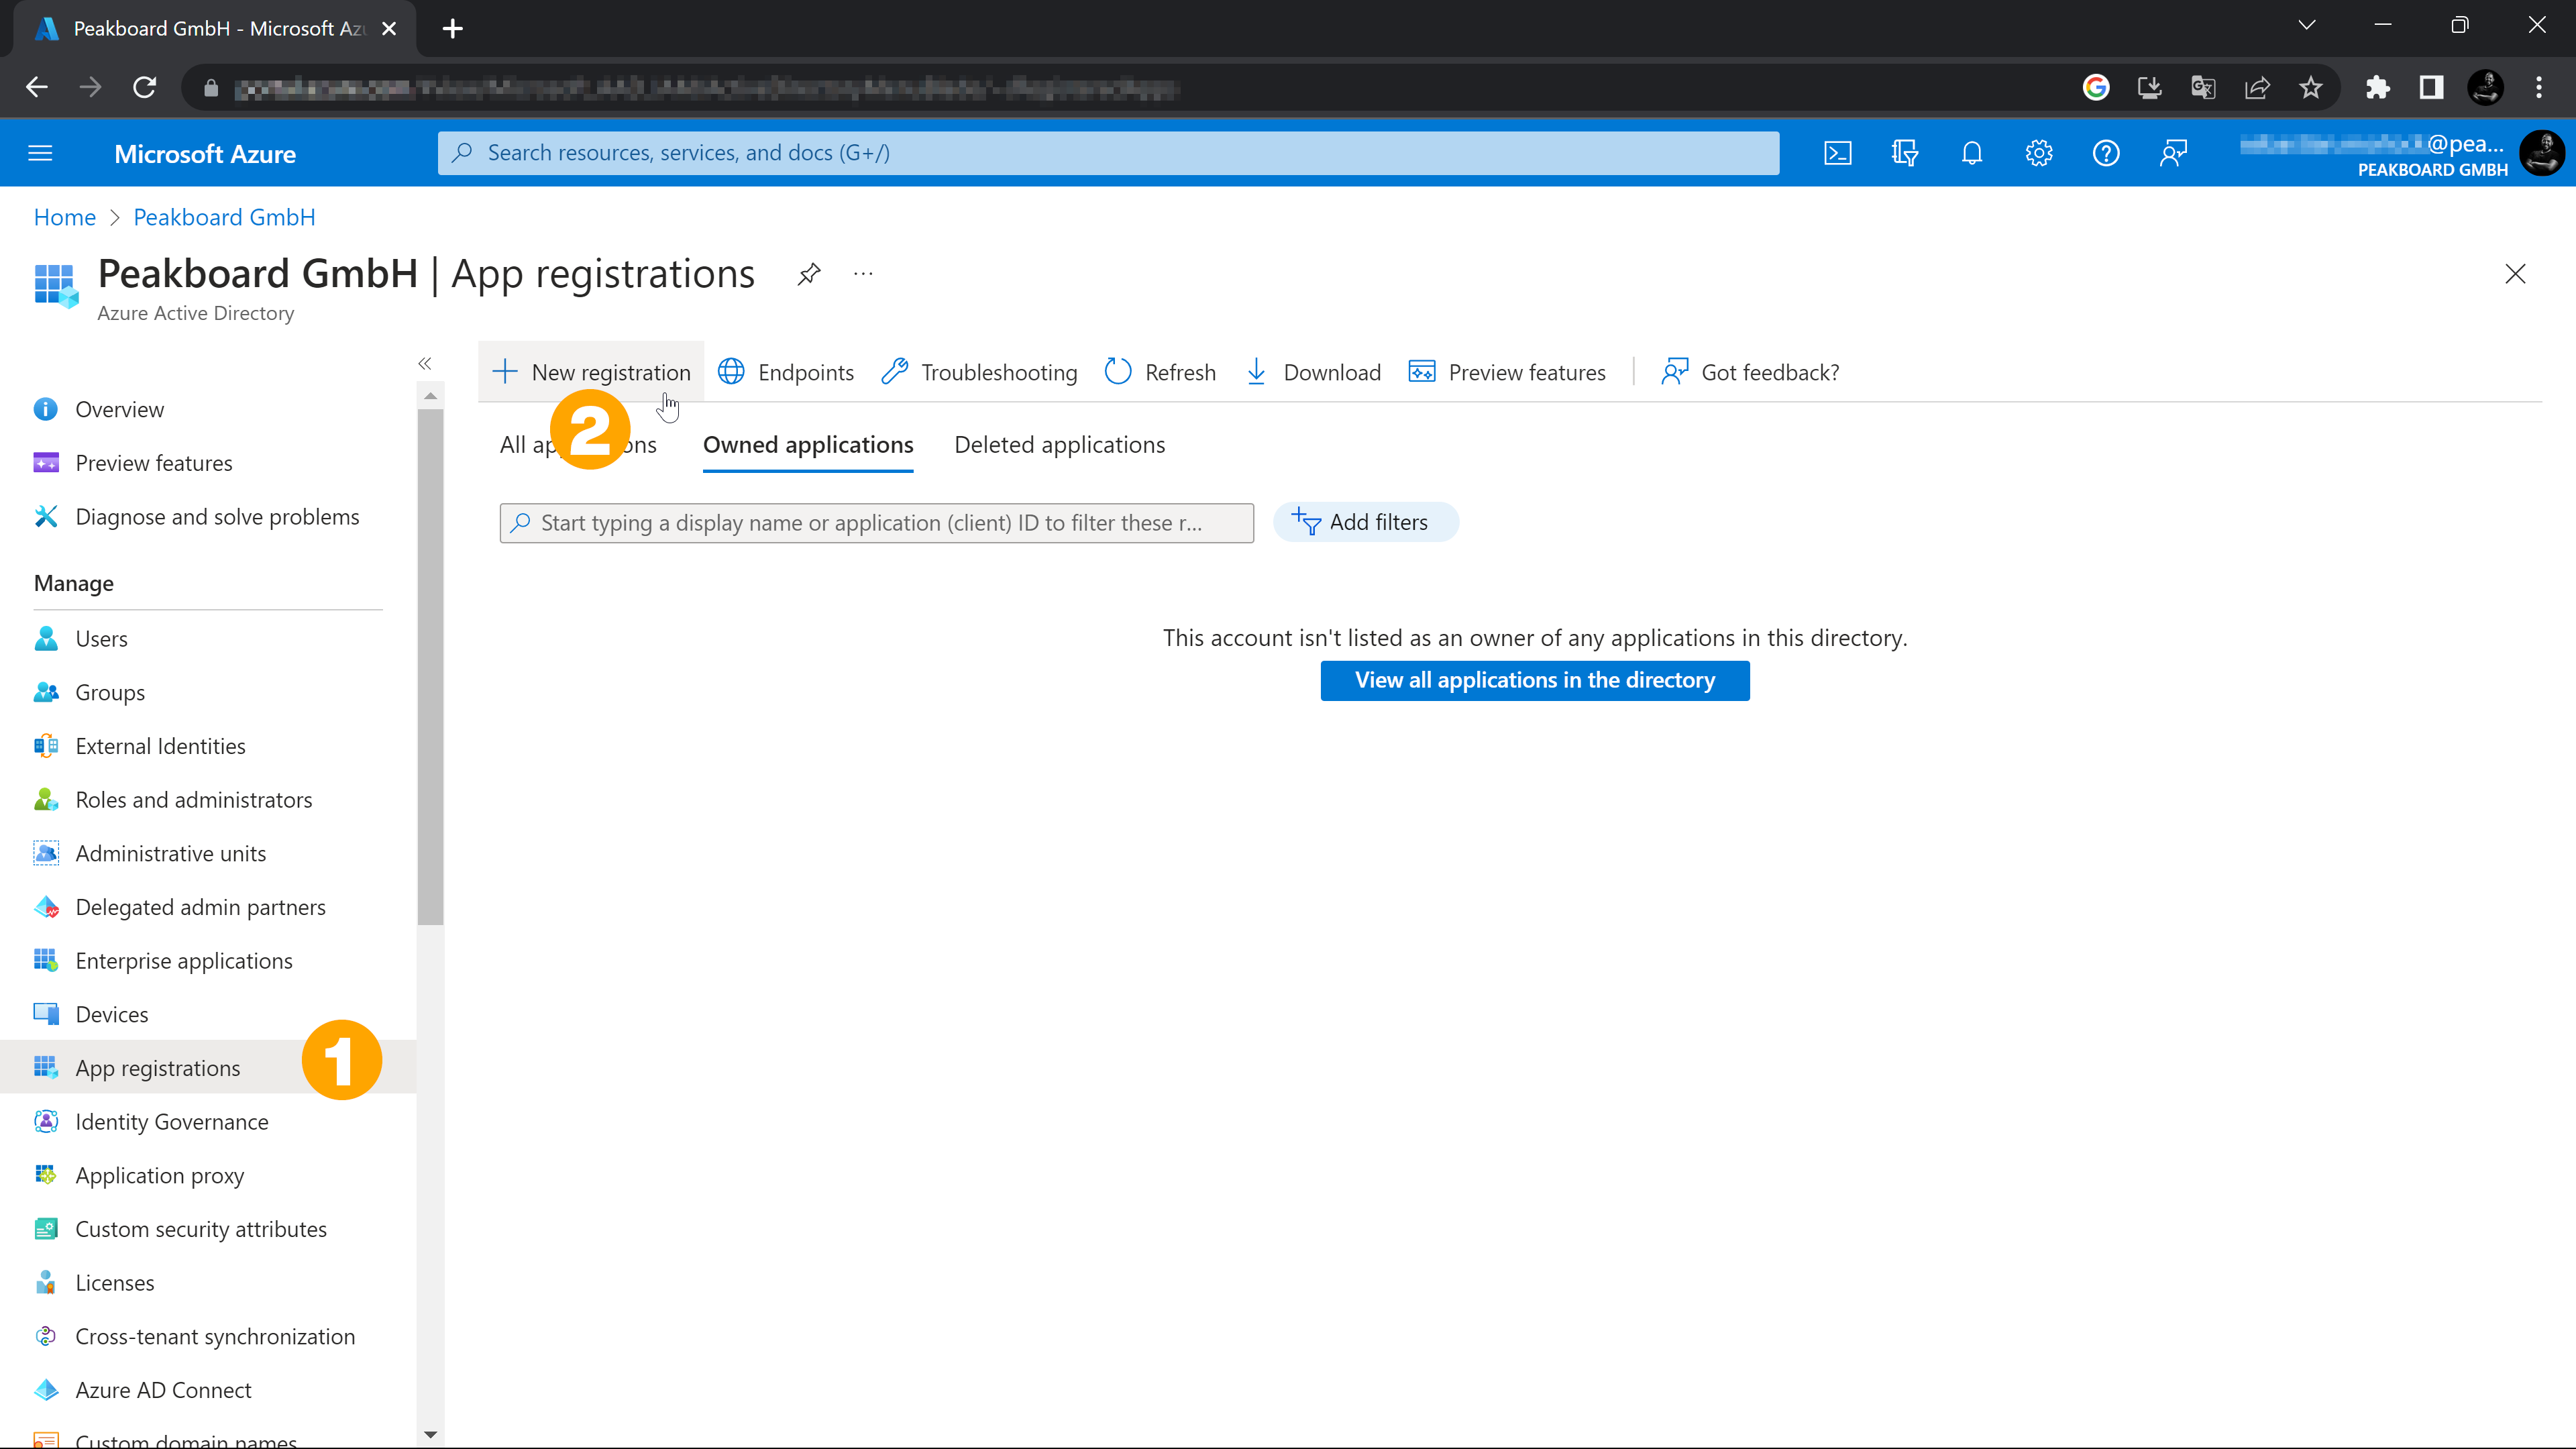
- Log in to your Azure account and select the Azure service Azure Active Directory. 2. Select [App registrations] (1) in the left menu and click the plus icon [New registration] (2) in the top menu.
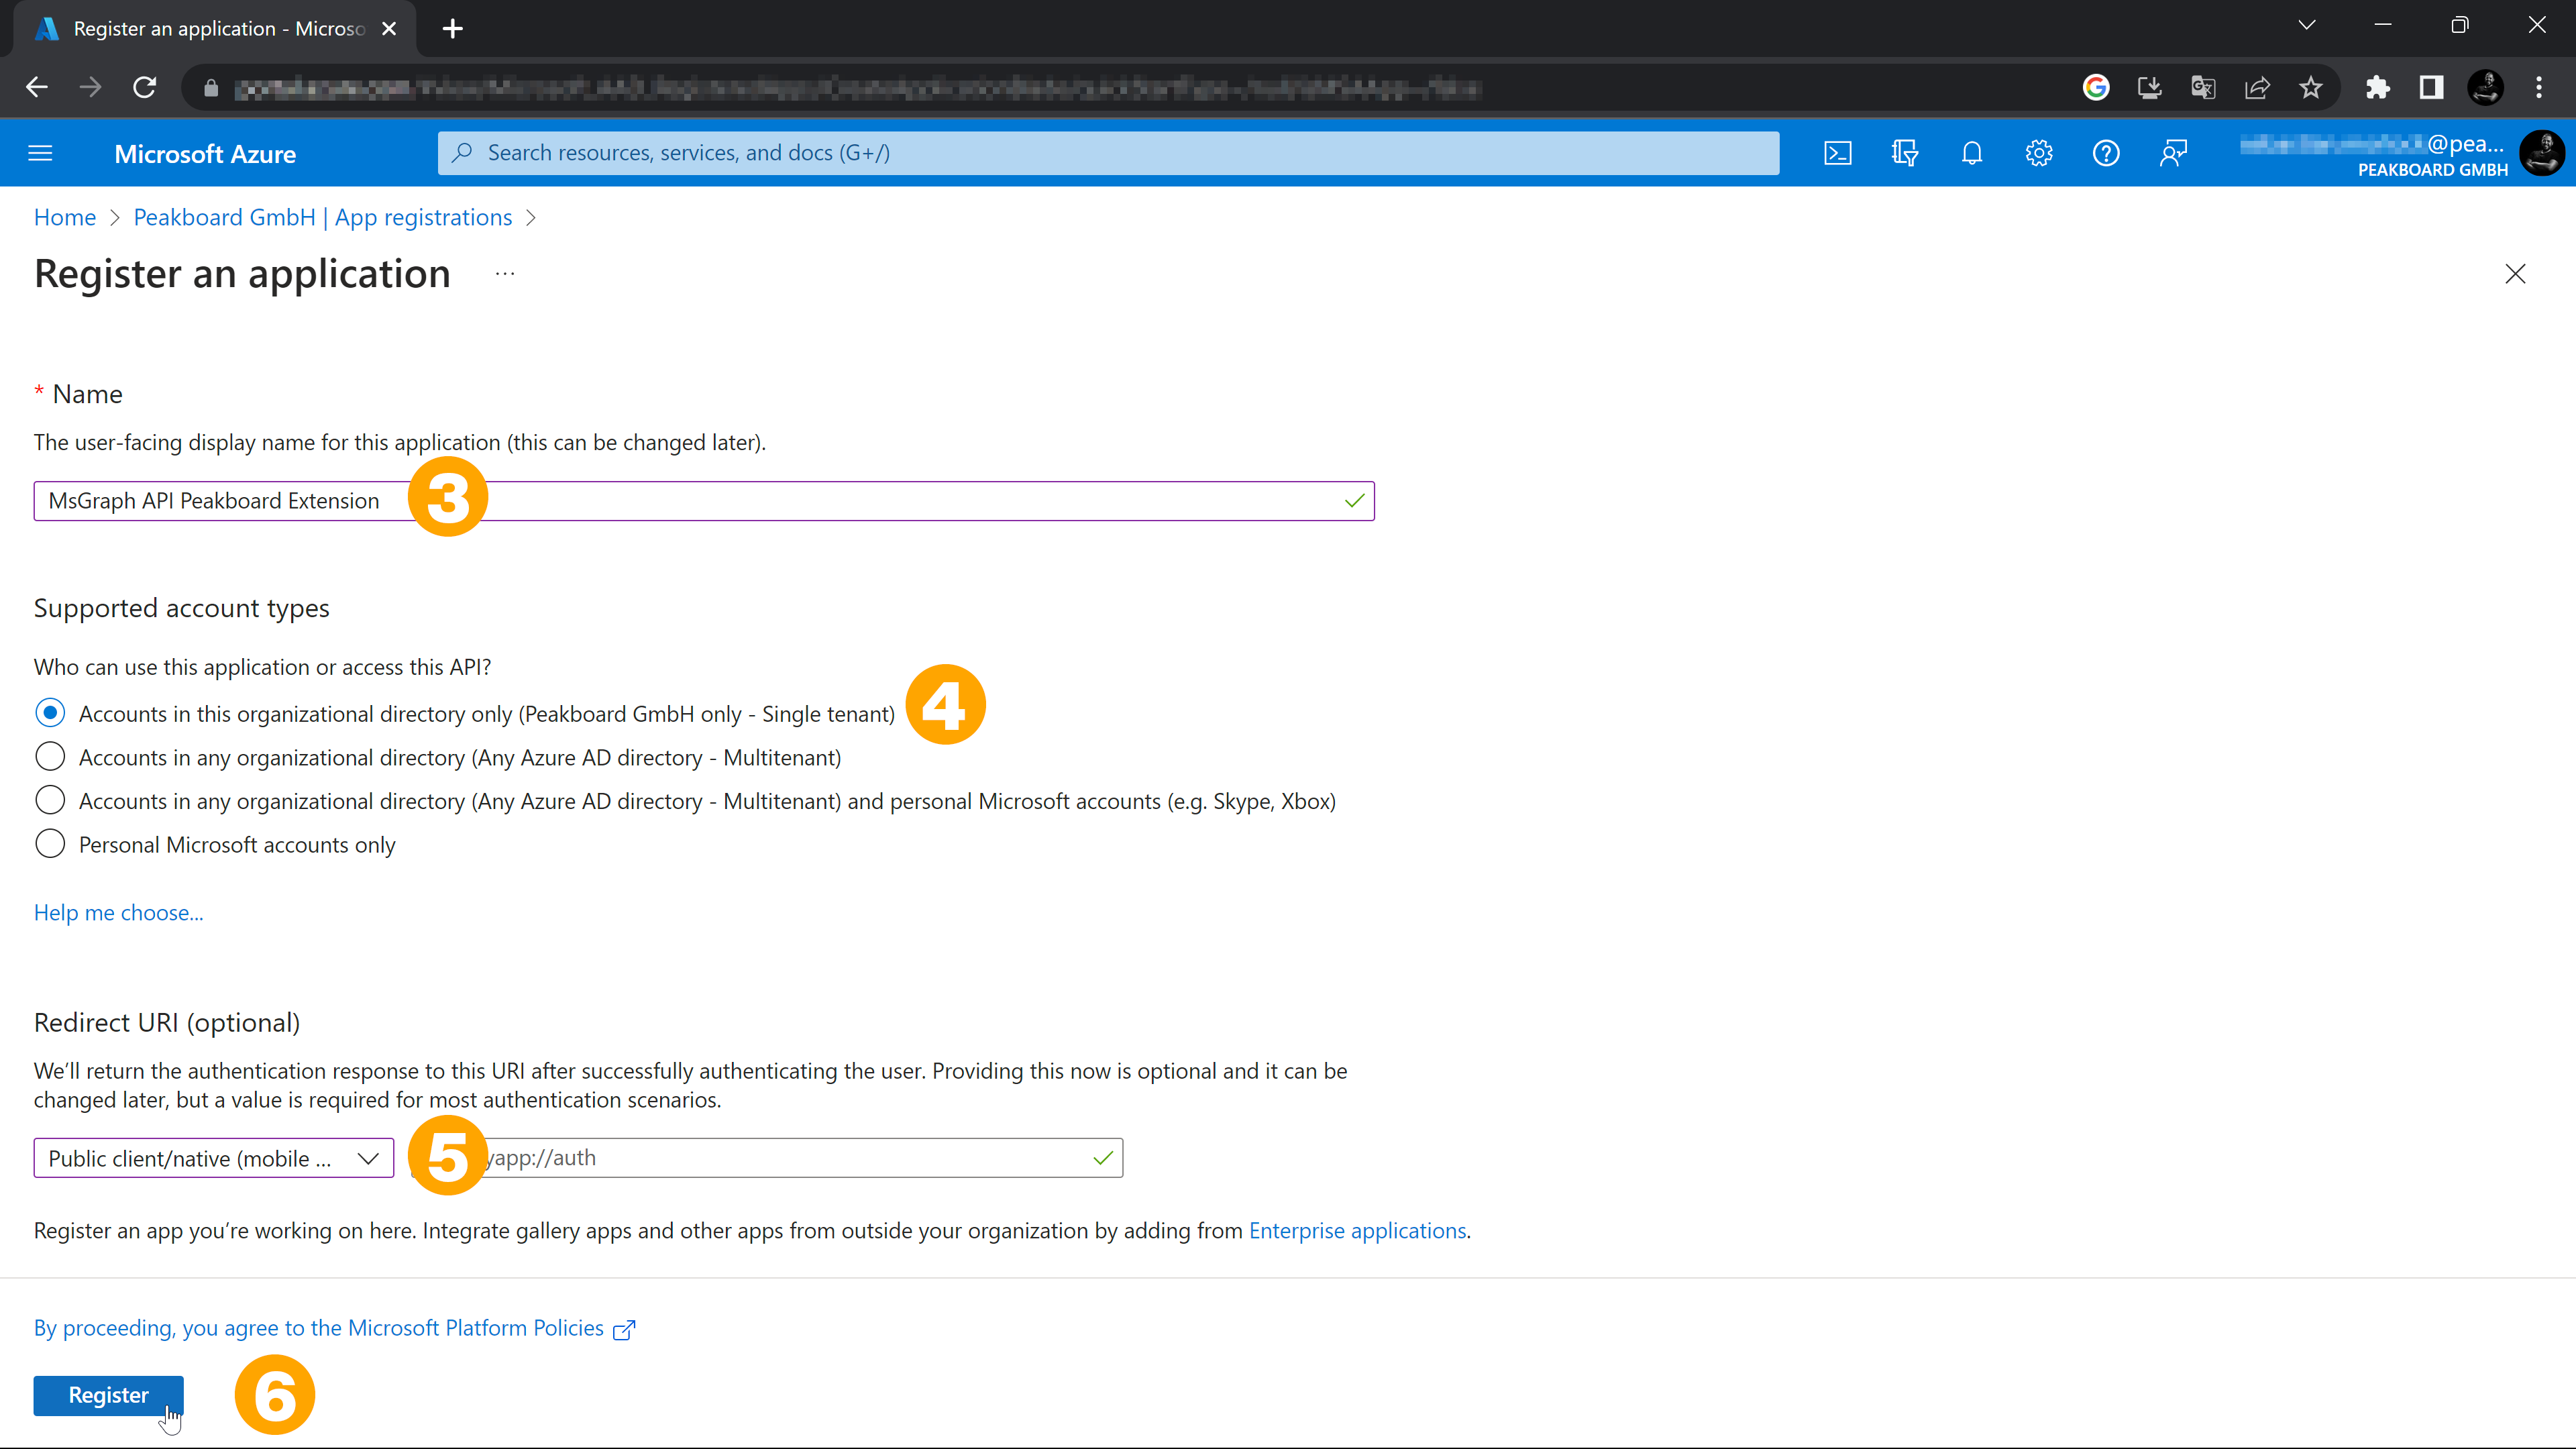
- Enter a suitable name (3) and select the type [single client] (4) as supported account type.
- Under redirection URI select [public client/native (mobile and desktop)] (5).
- Click the [Register] button (6).
Customize the app
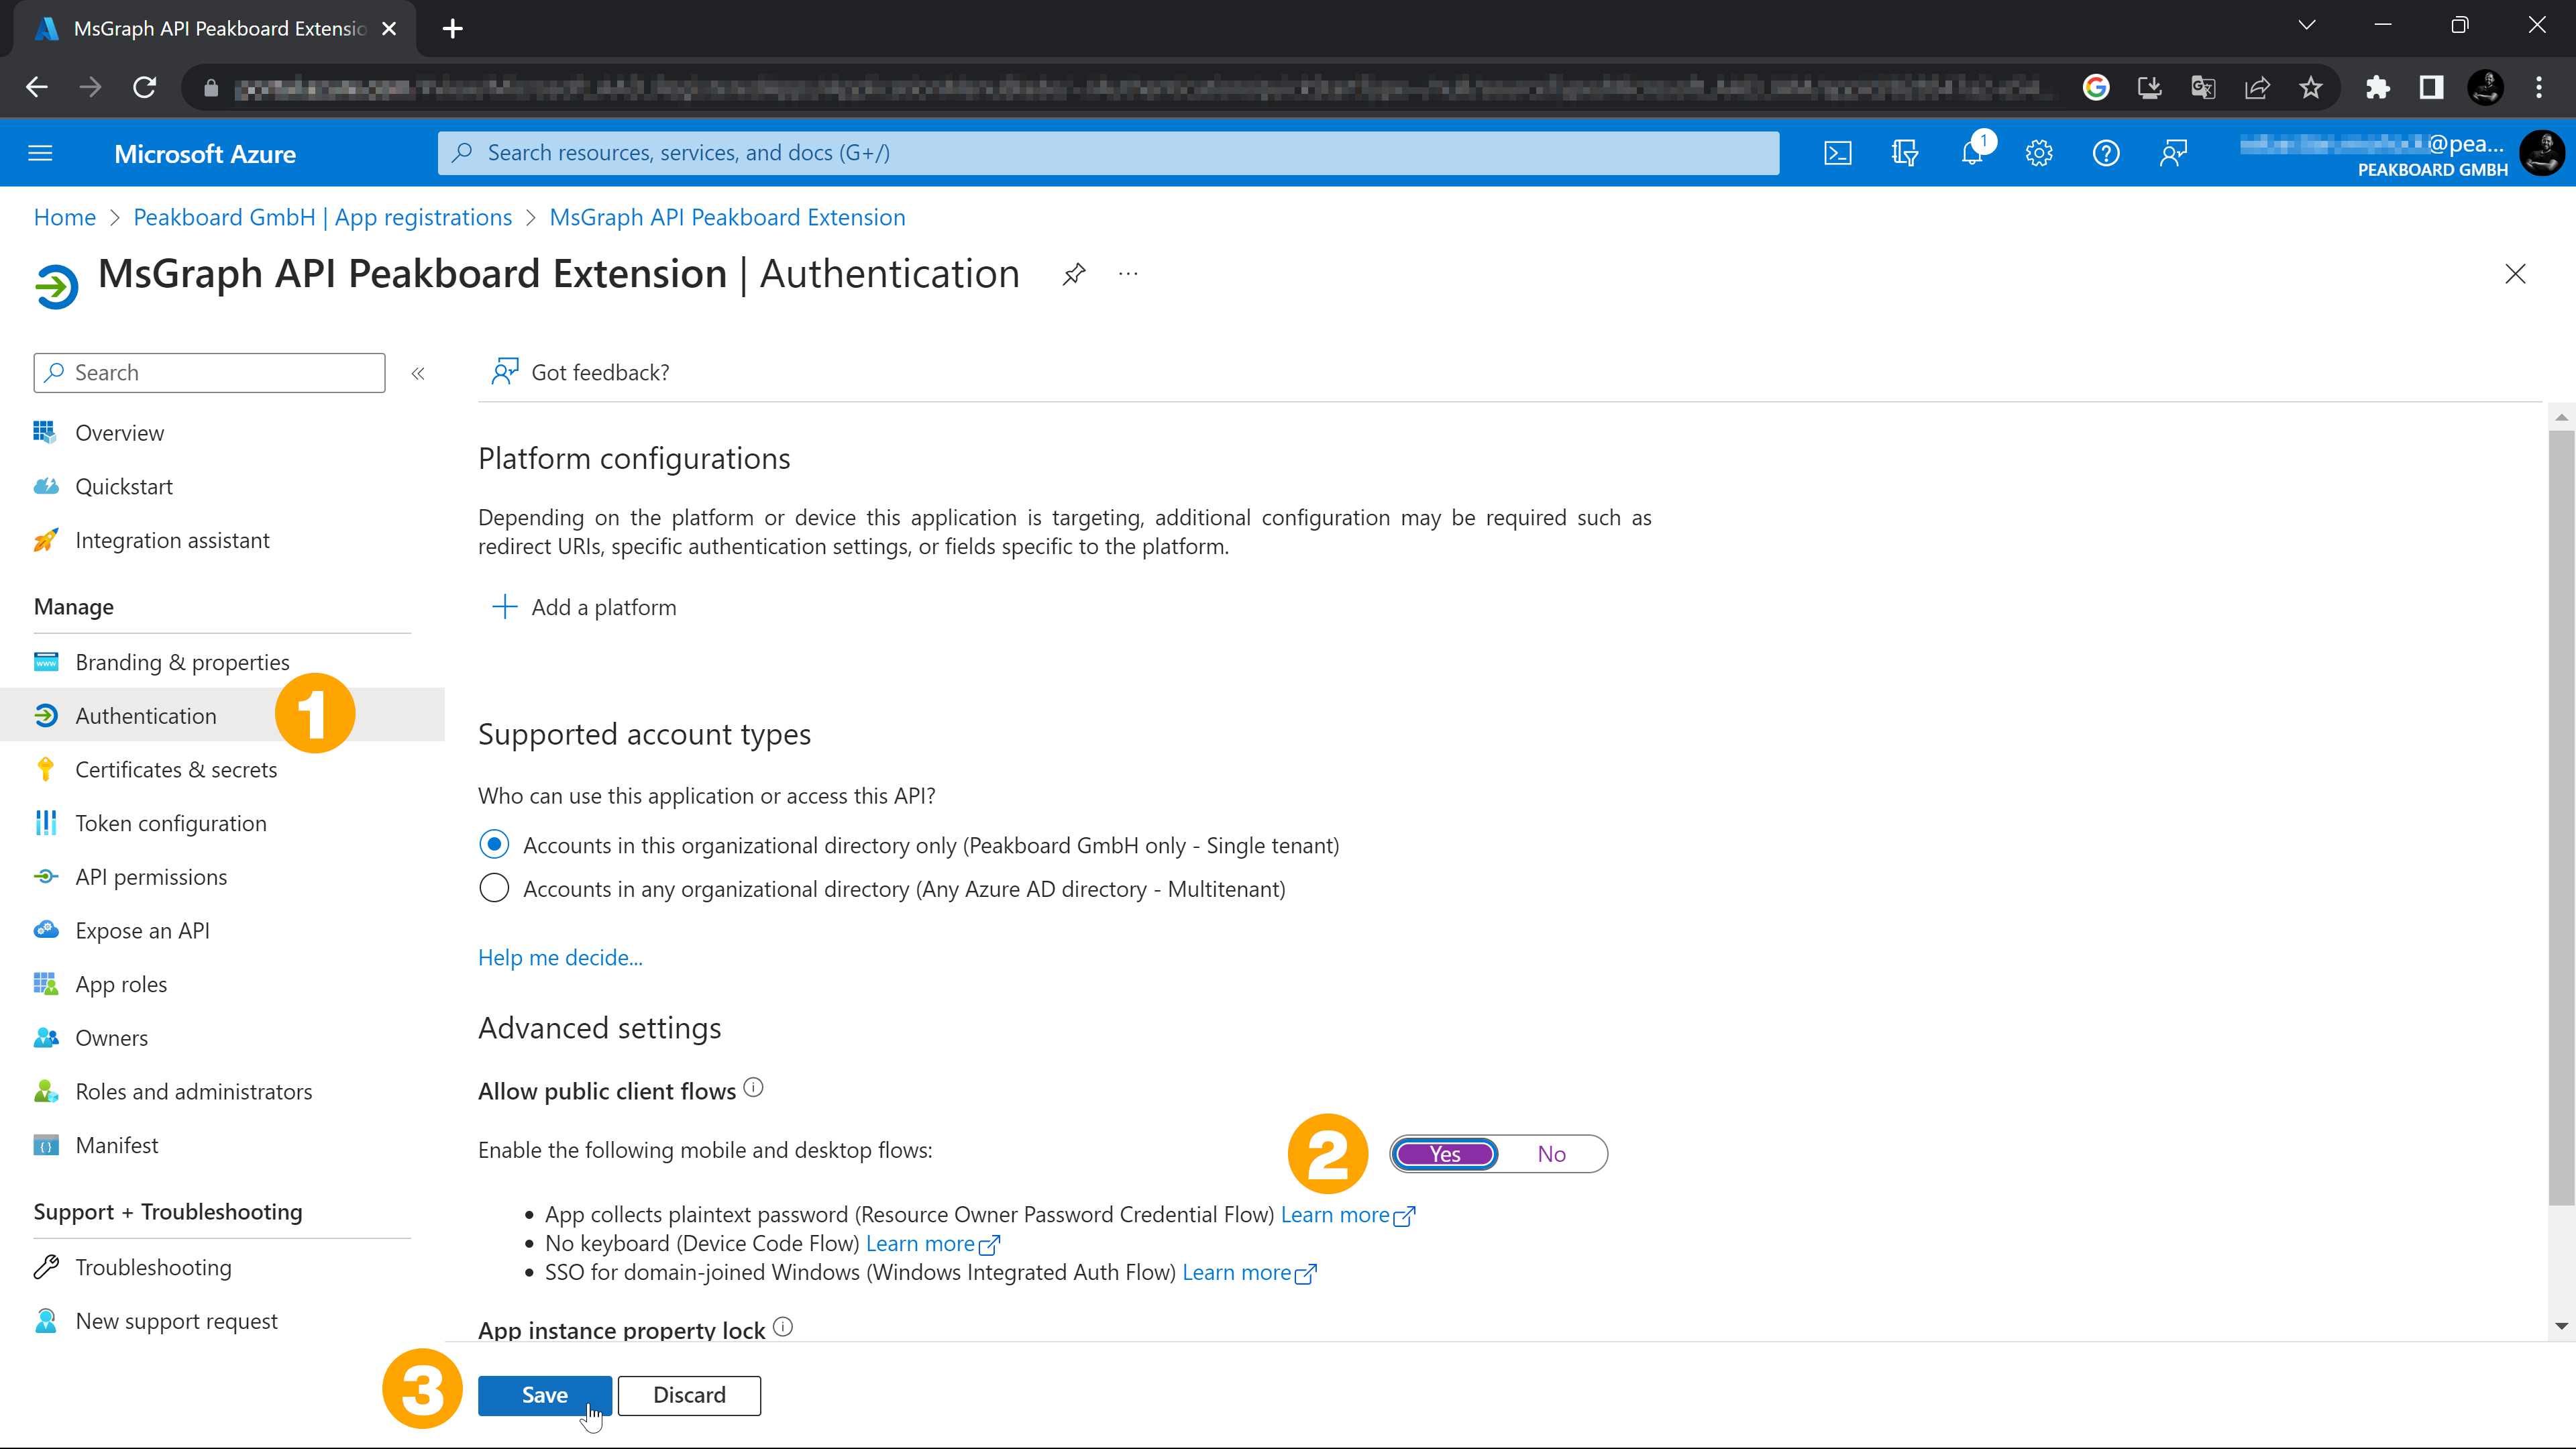
- The overview of the app opens automatically after registration. In the menu on the left, select [Authentication] (1).
- Under [Advanced settings] set the slider [Allow public client flows] to [Yes] (2).
- Click on the [Save] button (3).
- Use the menu on the left to switch to [API permissions] (4) to check them. Which permissions are needed for each query can be found in the Microsoft Graph documentation.
- Make appropriate adjustments if necessary, or get the necessary administrator permissions from an administrator.
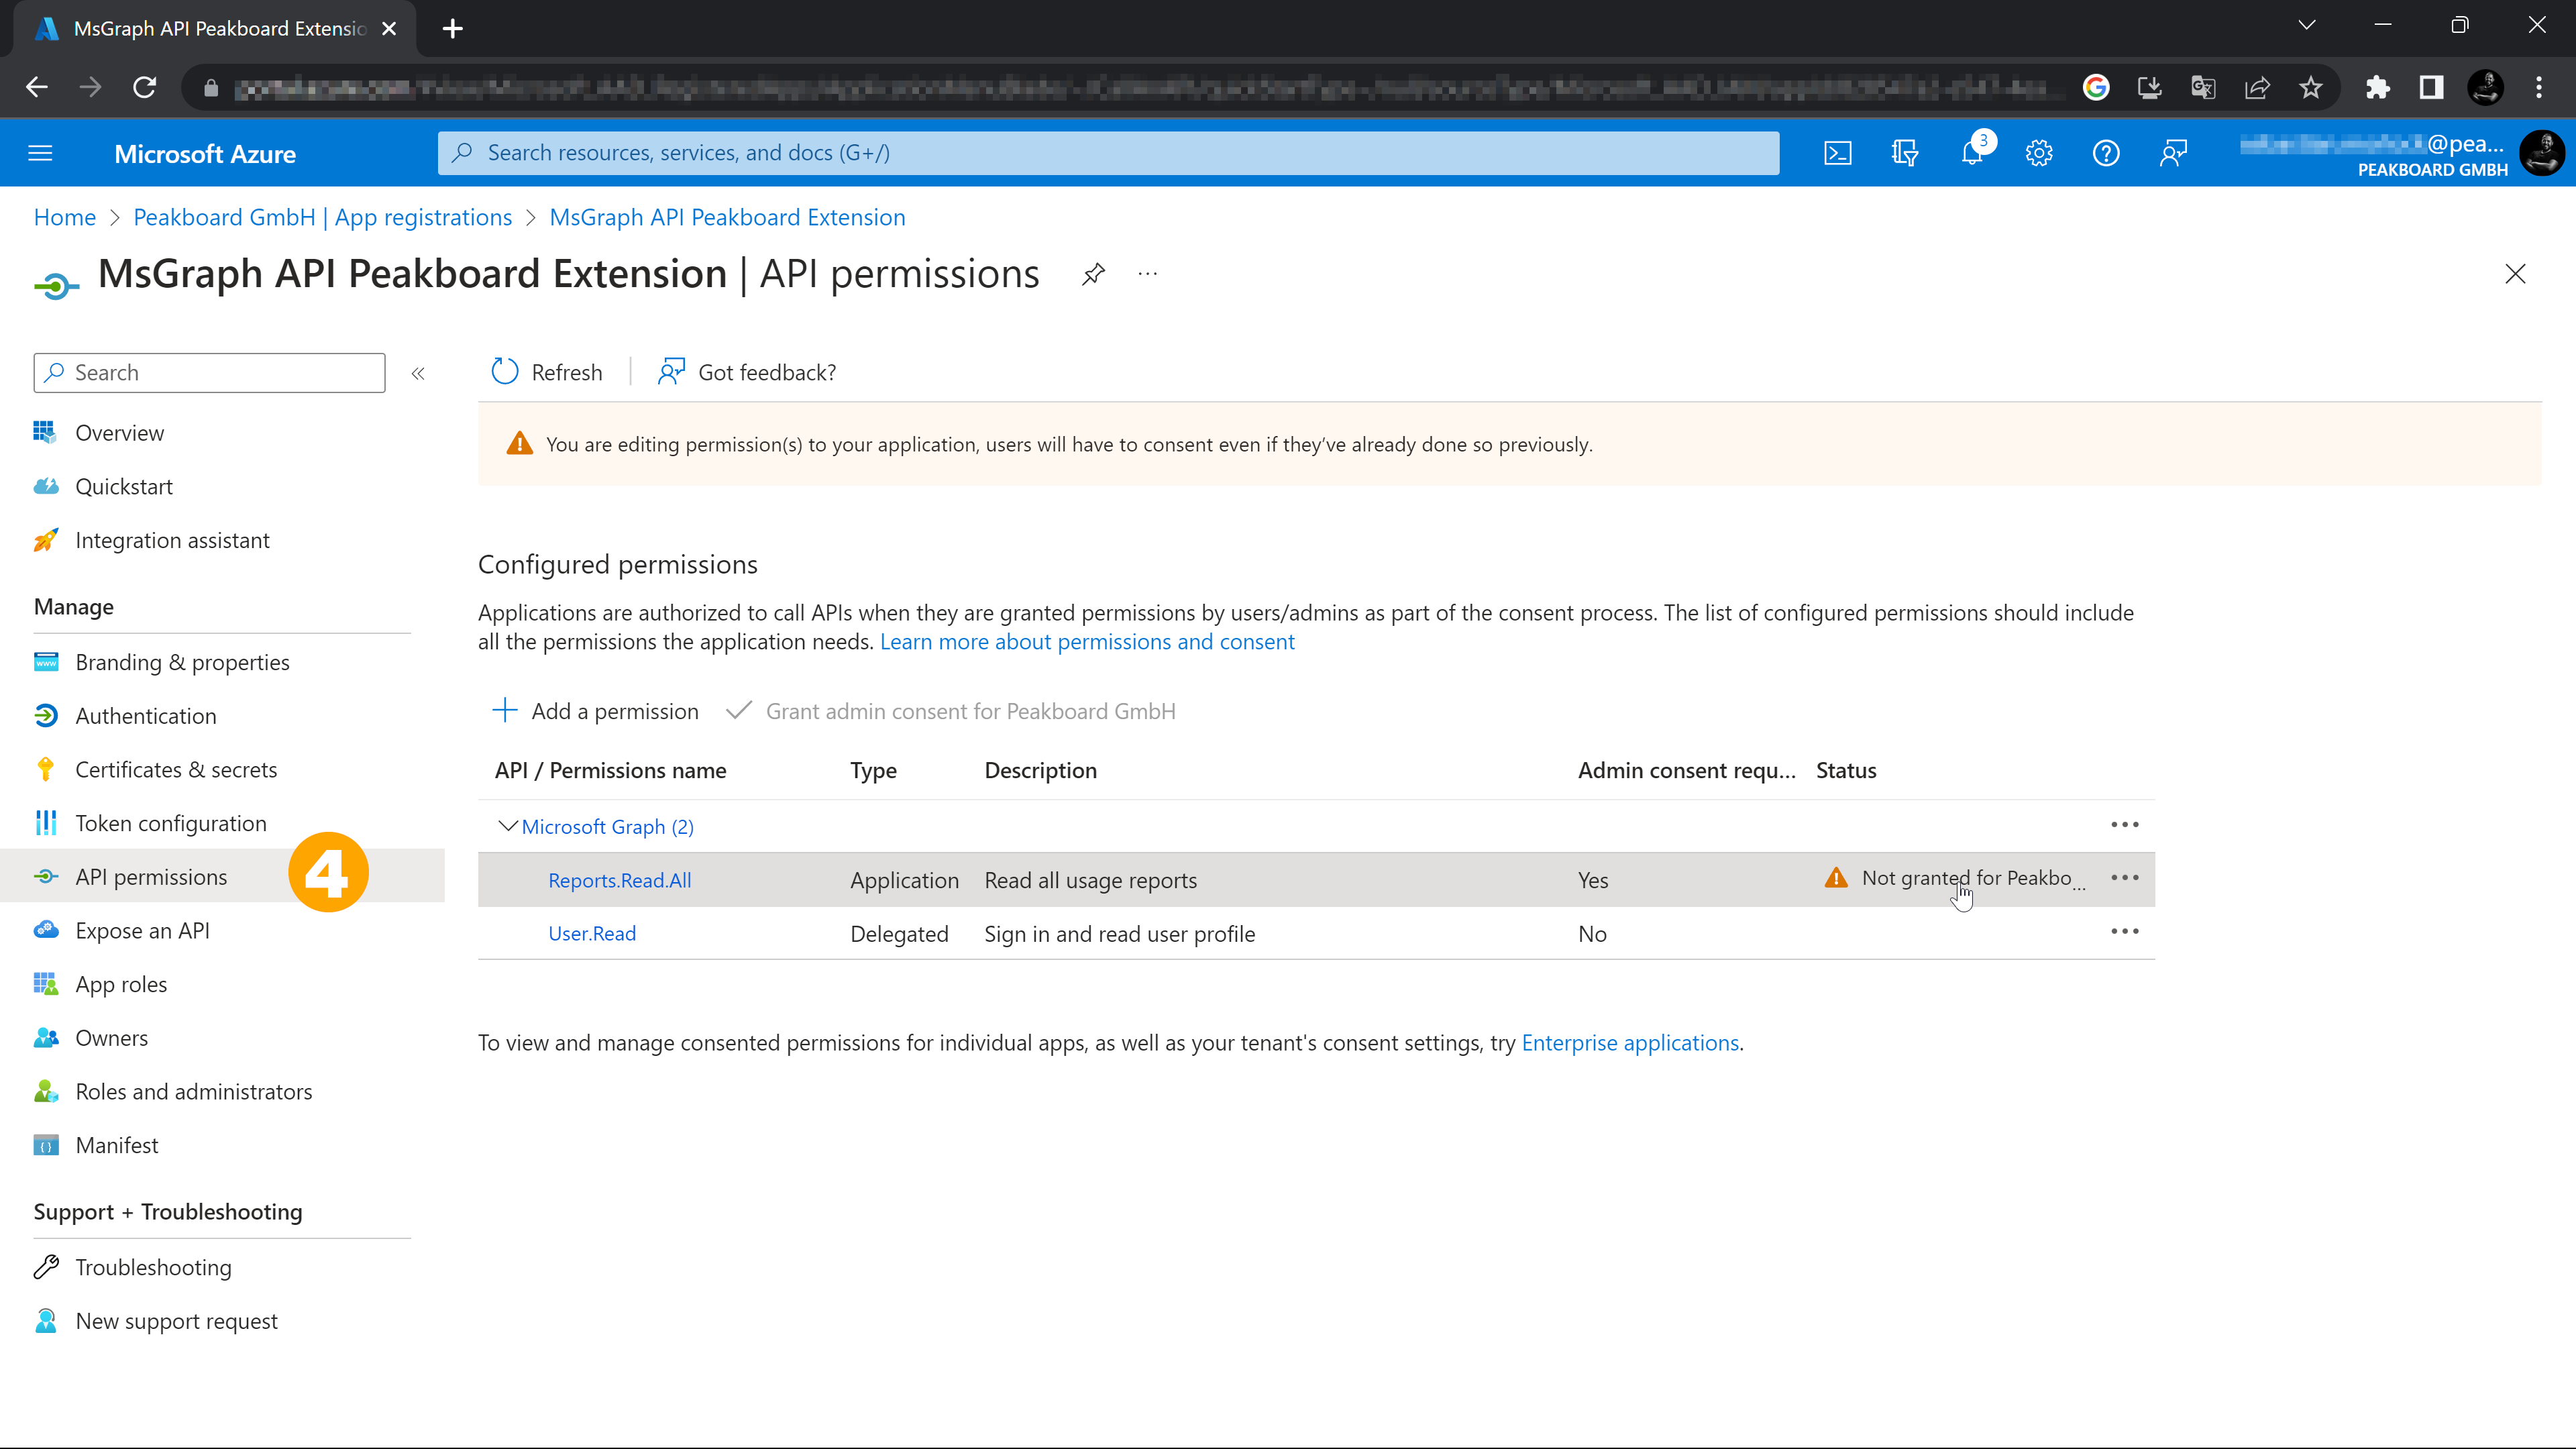
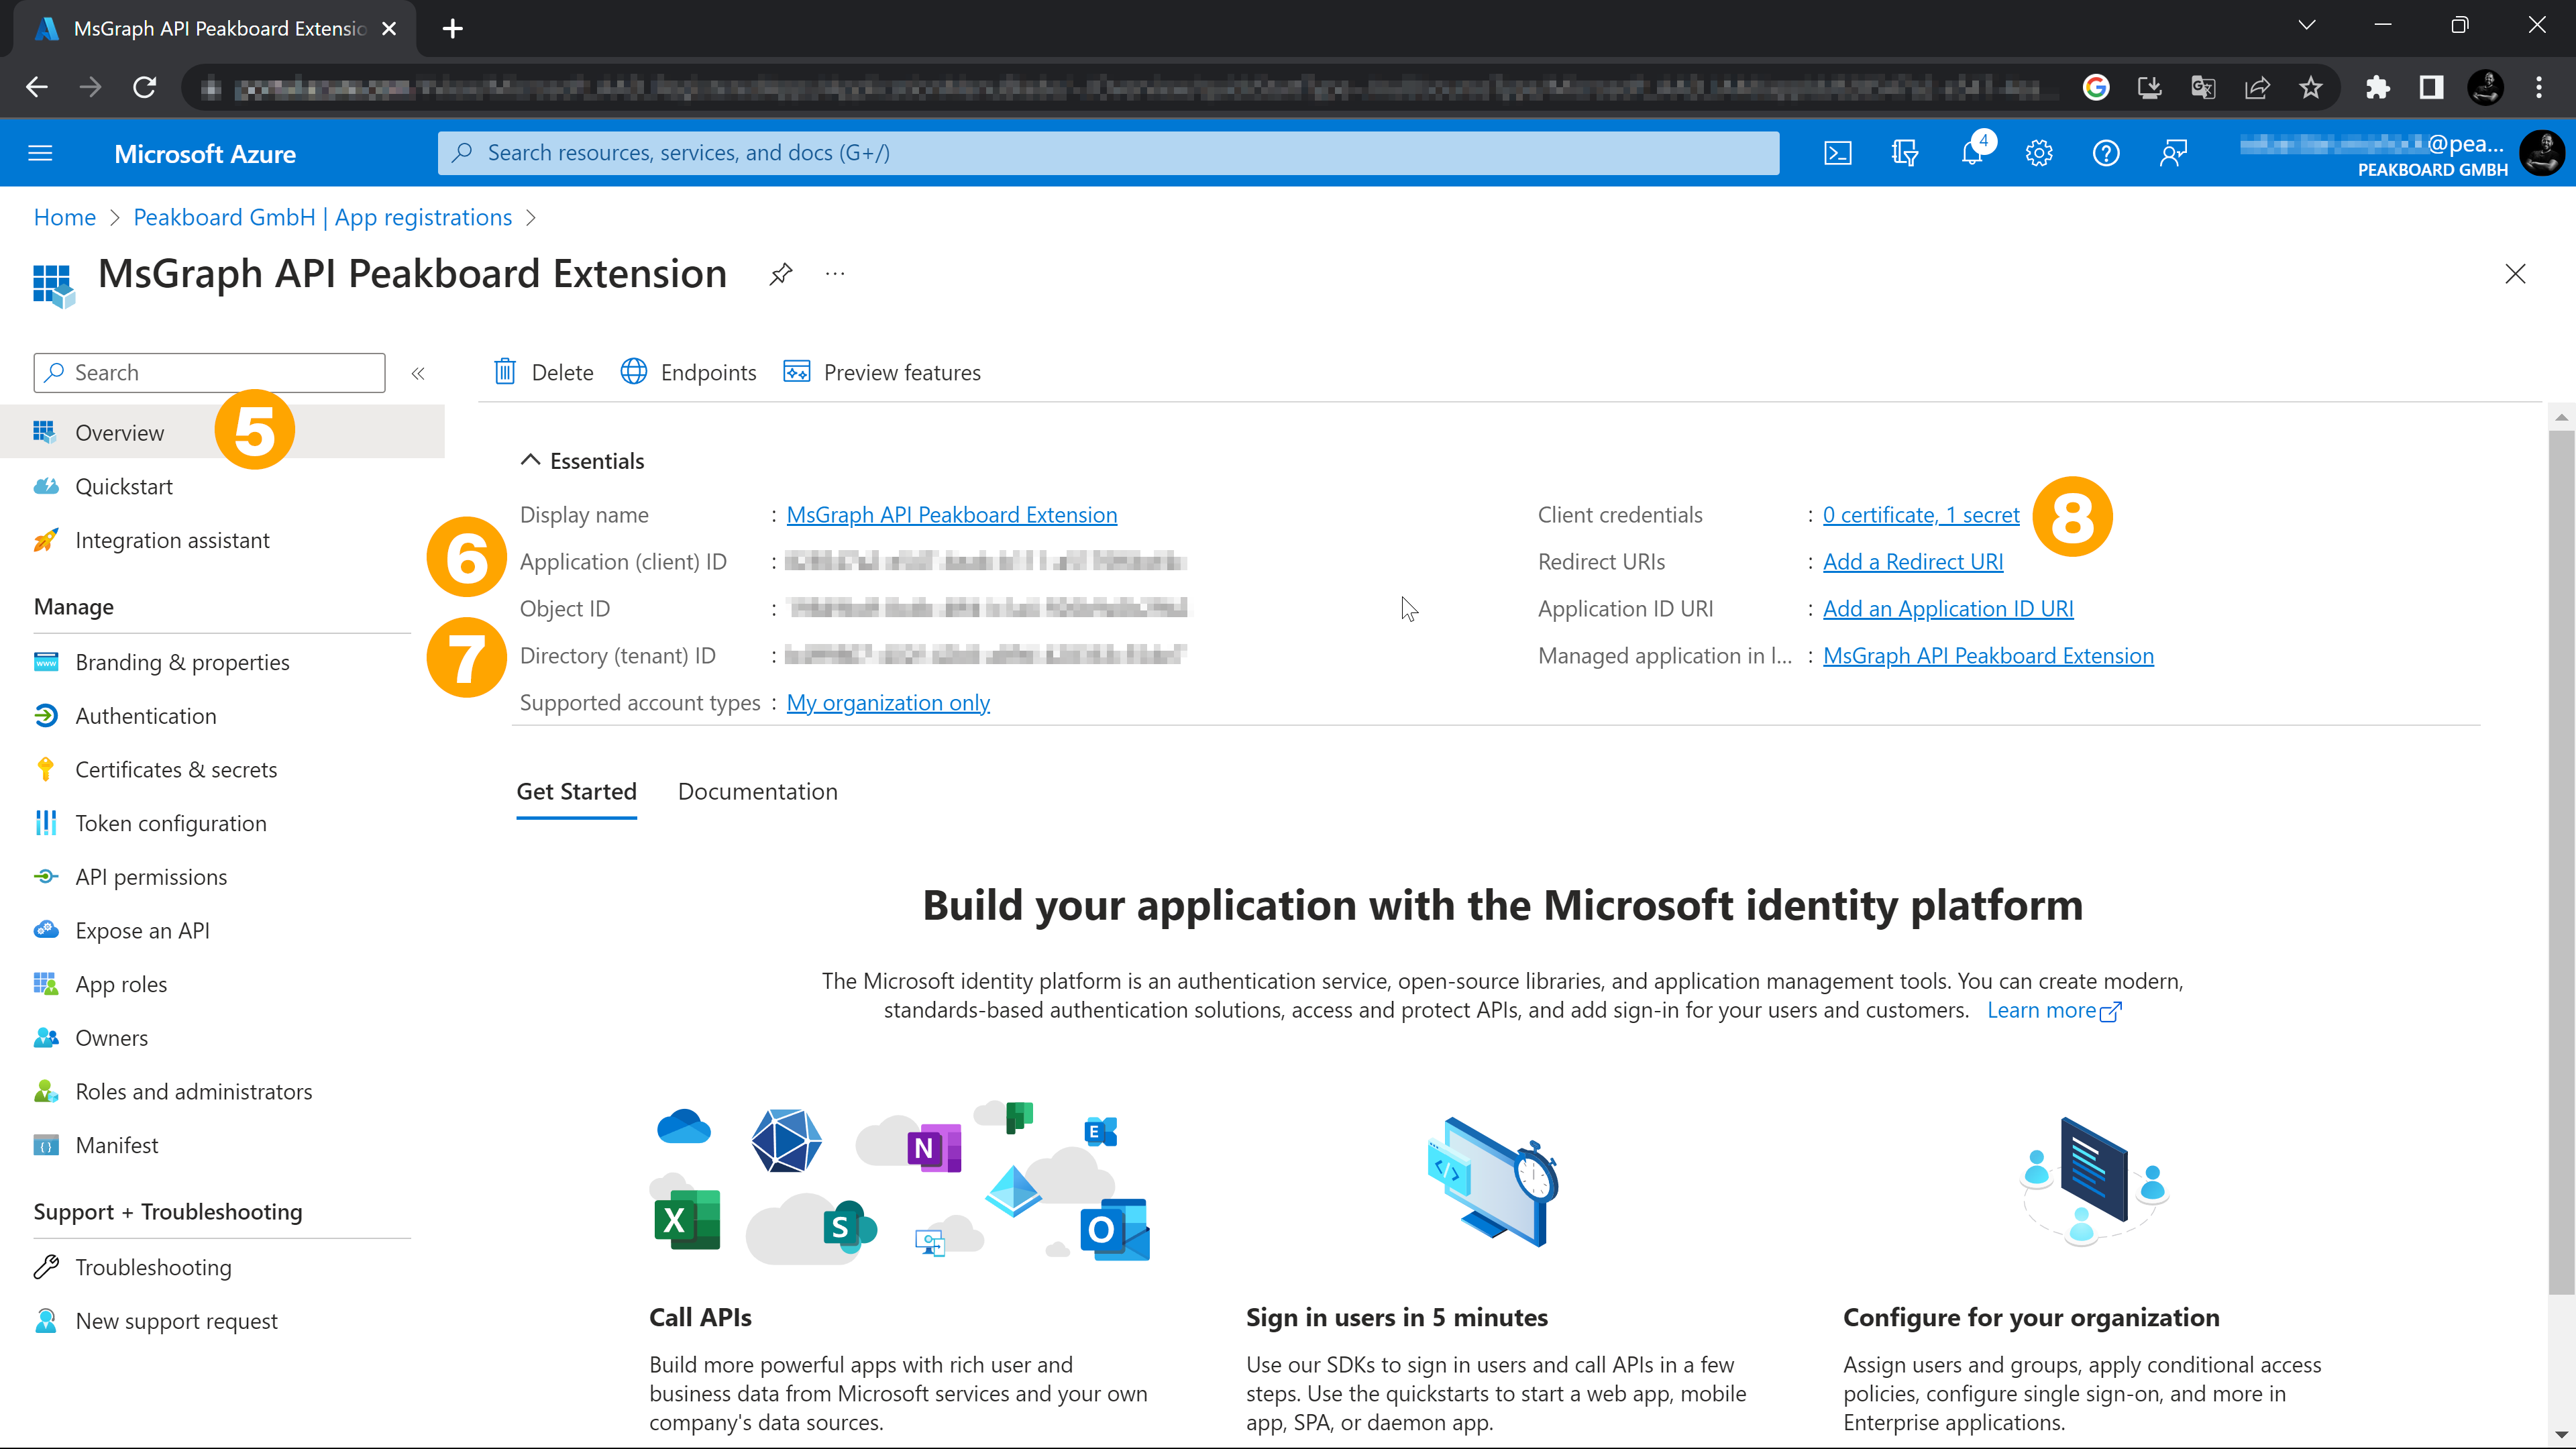
- Switch to the [Overview] section (5) via the menu on the left.
- For the next step you will need the IDs [Application ID (Client)] (6) and [Directory ID (Client)] (7) as well as the Client Secret (8). If you have newly registered the app, you have to create it first.
Installing the Microsoft Graph API Extension
After the download and the installation of the Microsoft Graph API Extension three different access types (1) are available under [data sources].
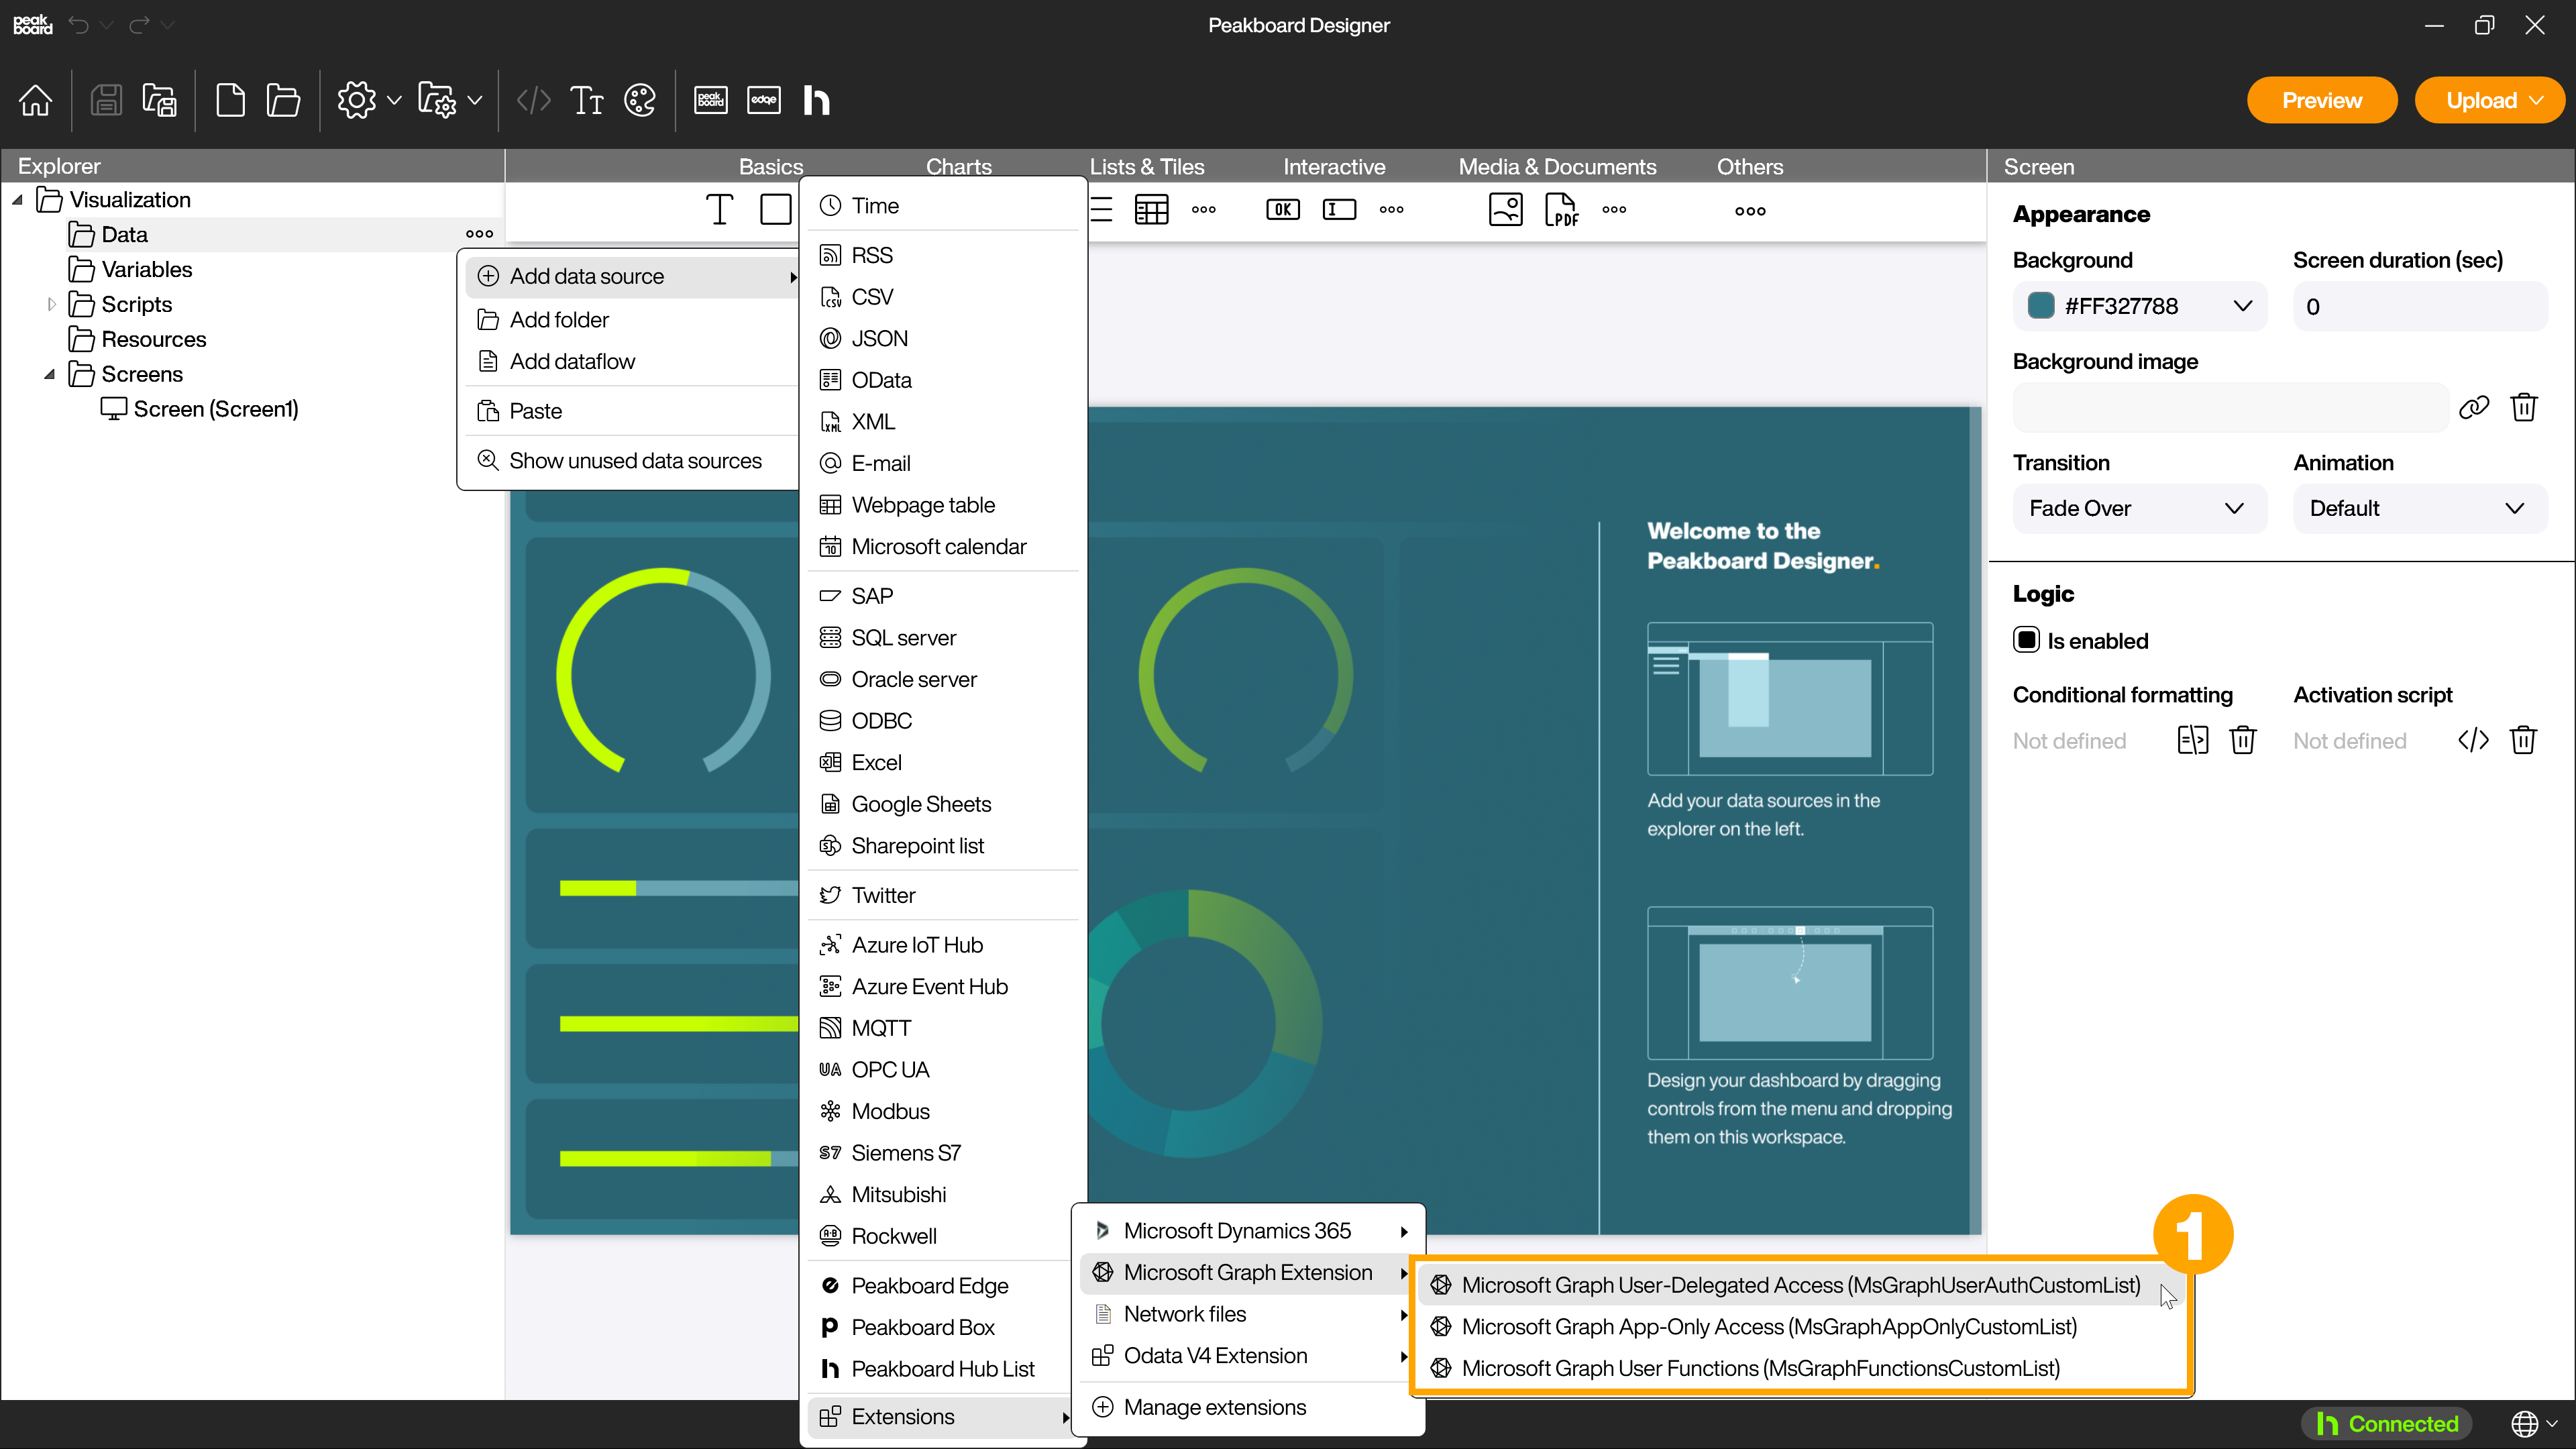
Microsoft Graph user-delegated access
In this variant, you access the Microsoft Graph data with the name and the corresponding rights of a specific user. To use this variant you need to authenticate with your desired user. This is the most common type of access.
Microsoft Graph app-only access
In contrast to user-delegated access, with this variant you only access the data with the name and rights of the app. Separate authentication is not necessary each time.
Microsoft Graph user functions
You use the user functions when you want to call certain functions to perform an action instead of just querying a list. To use this variant, authentication is again required as with user-delegated access.
Microsoft Graph Explorer
Since the selection of queries and functions is quite extensive, Microsoft offers a handy tool to browse and test the Microsoft Graph functions, the Graph Explorer.
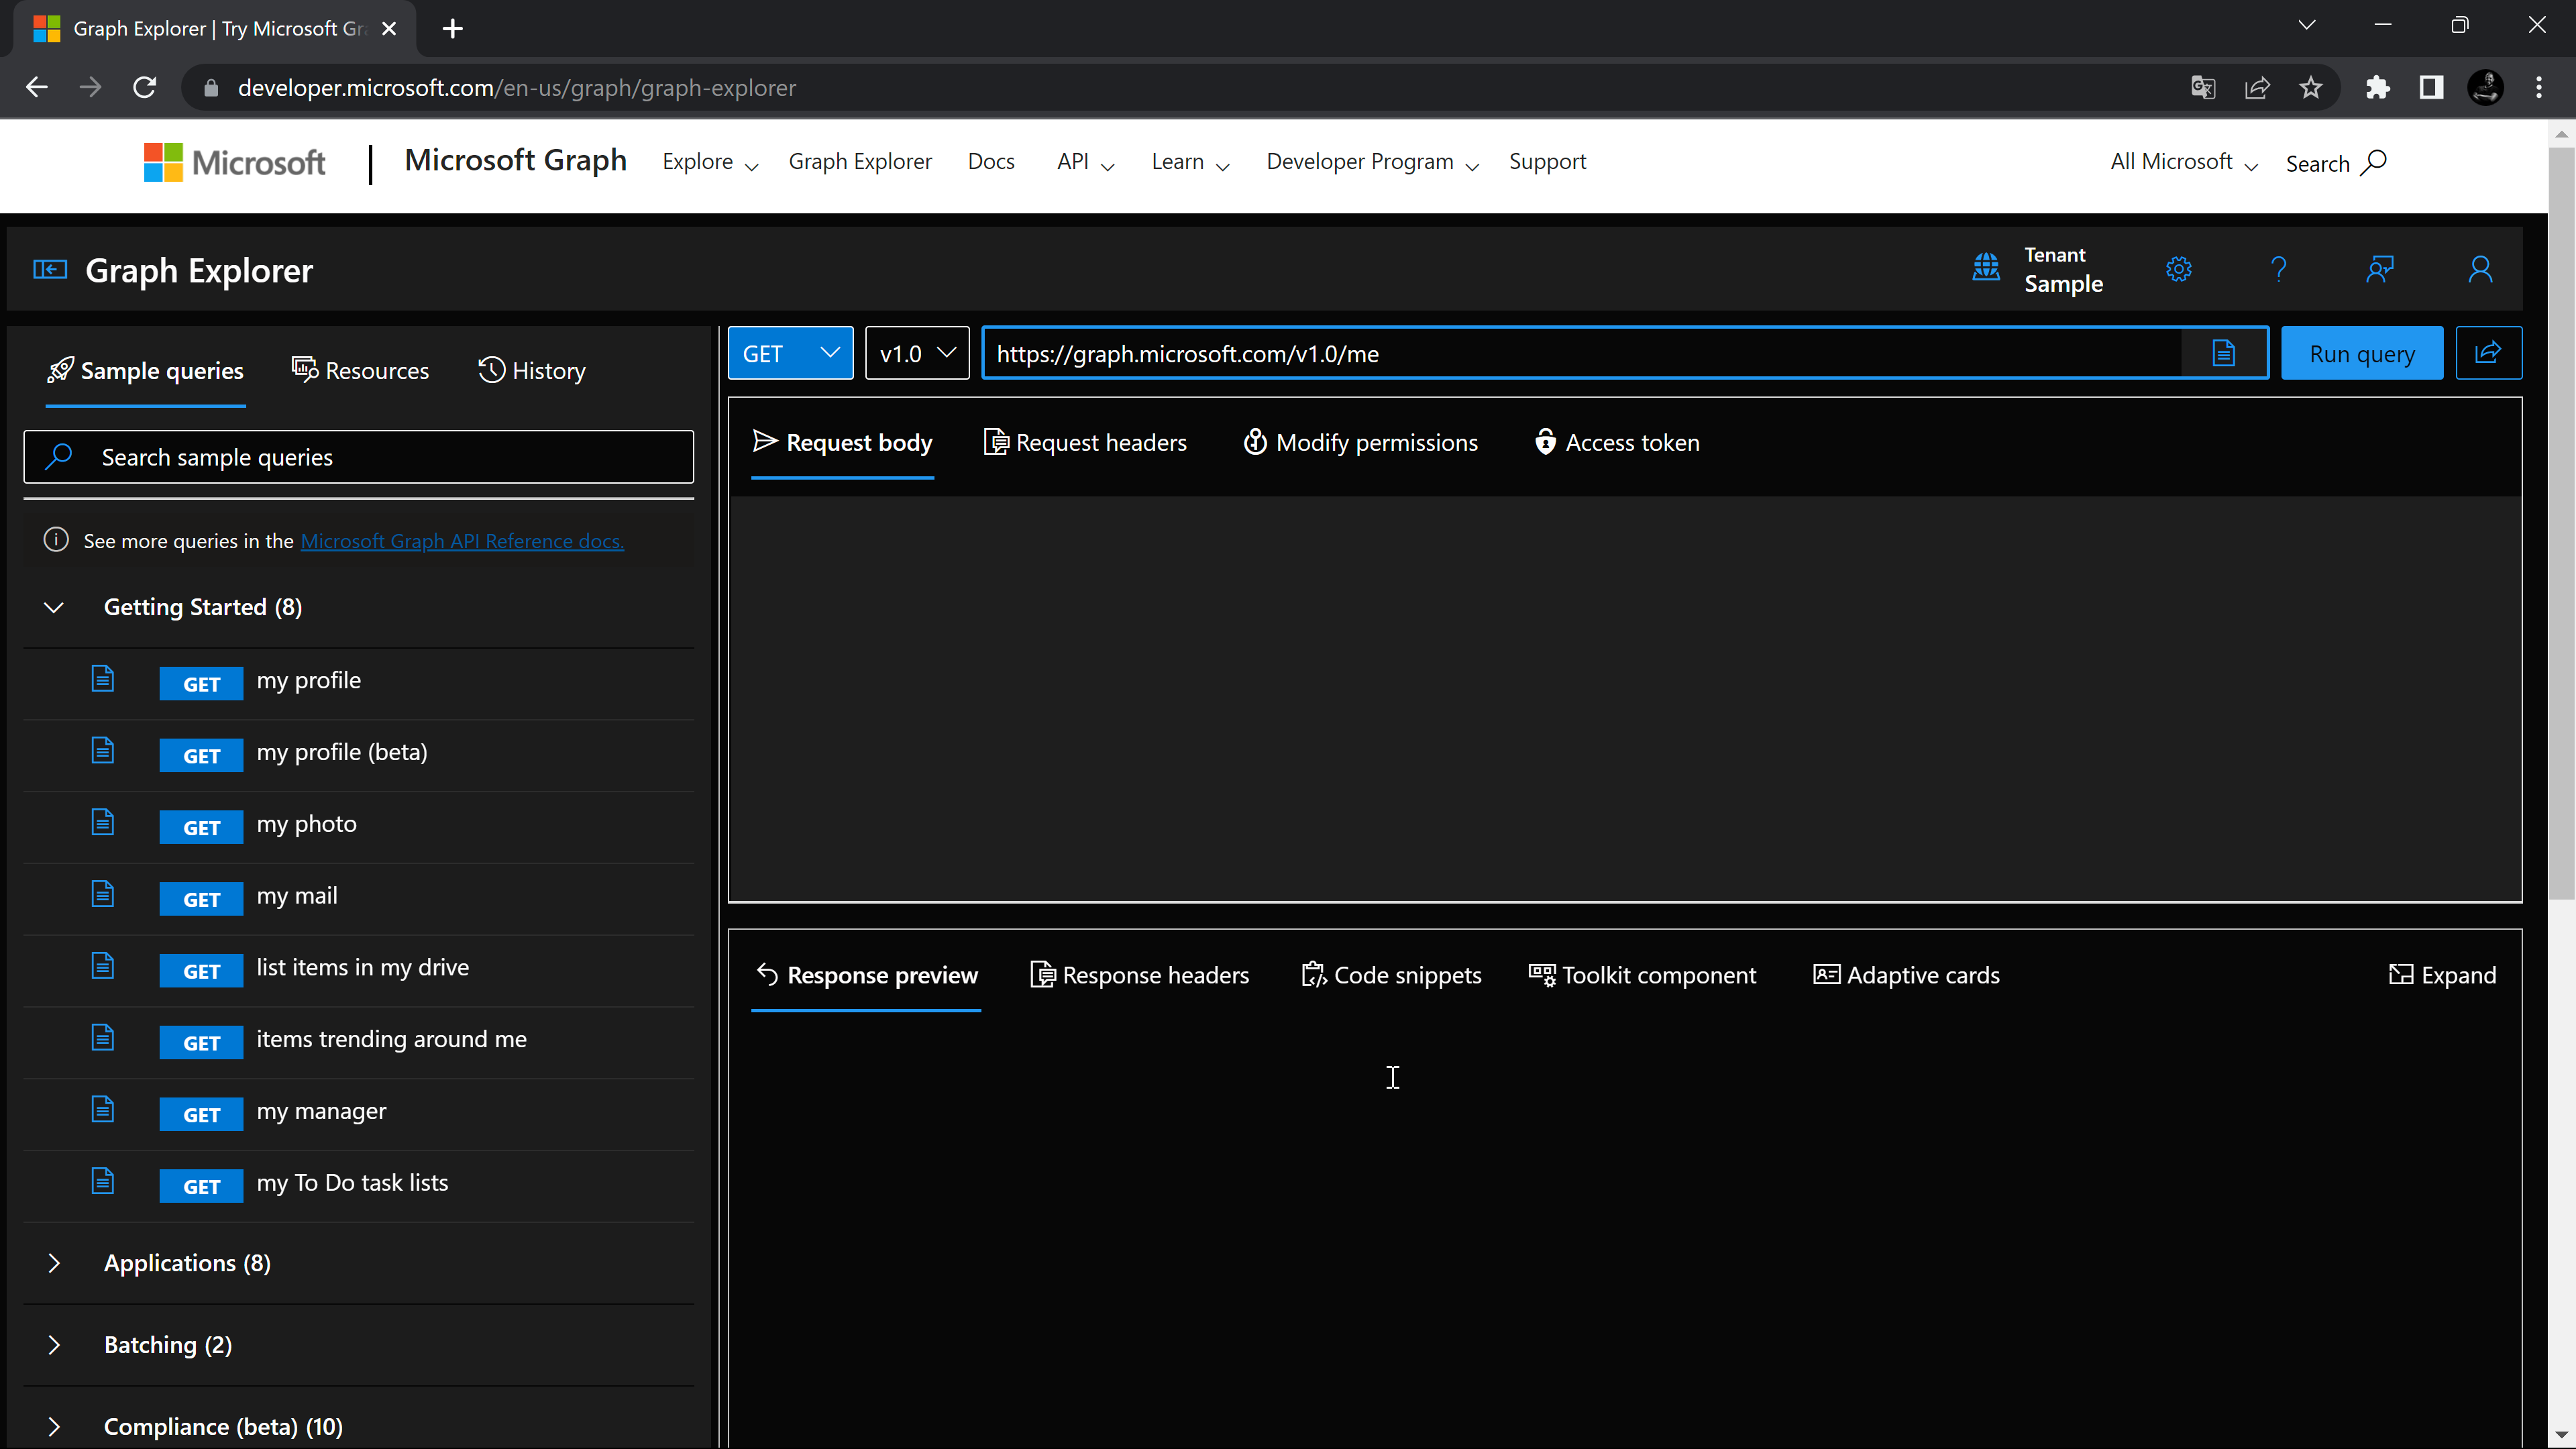
In the accompanying documentation you will also find many example queries that you can use.
Add a query in the Peakboard Designer
As an example, let’s call a usage report from Office 365. The report lists the aggregated Outlook activity per day for the entire organization. Reports like this are useful for giving system administrators insights into what’s happening in their Office 365 tenant, for example. Find related documentation here
Configure data source
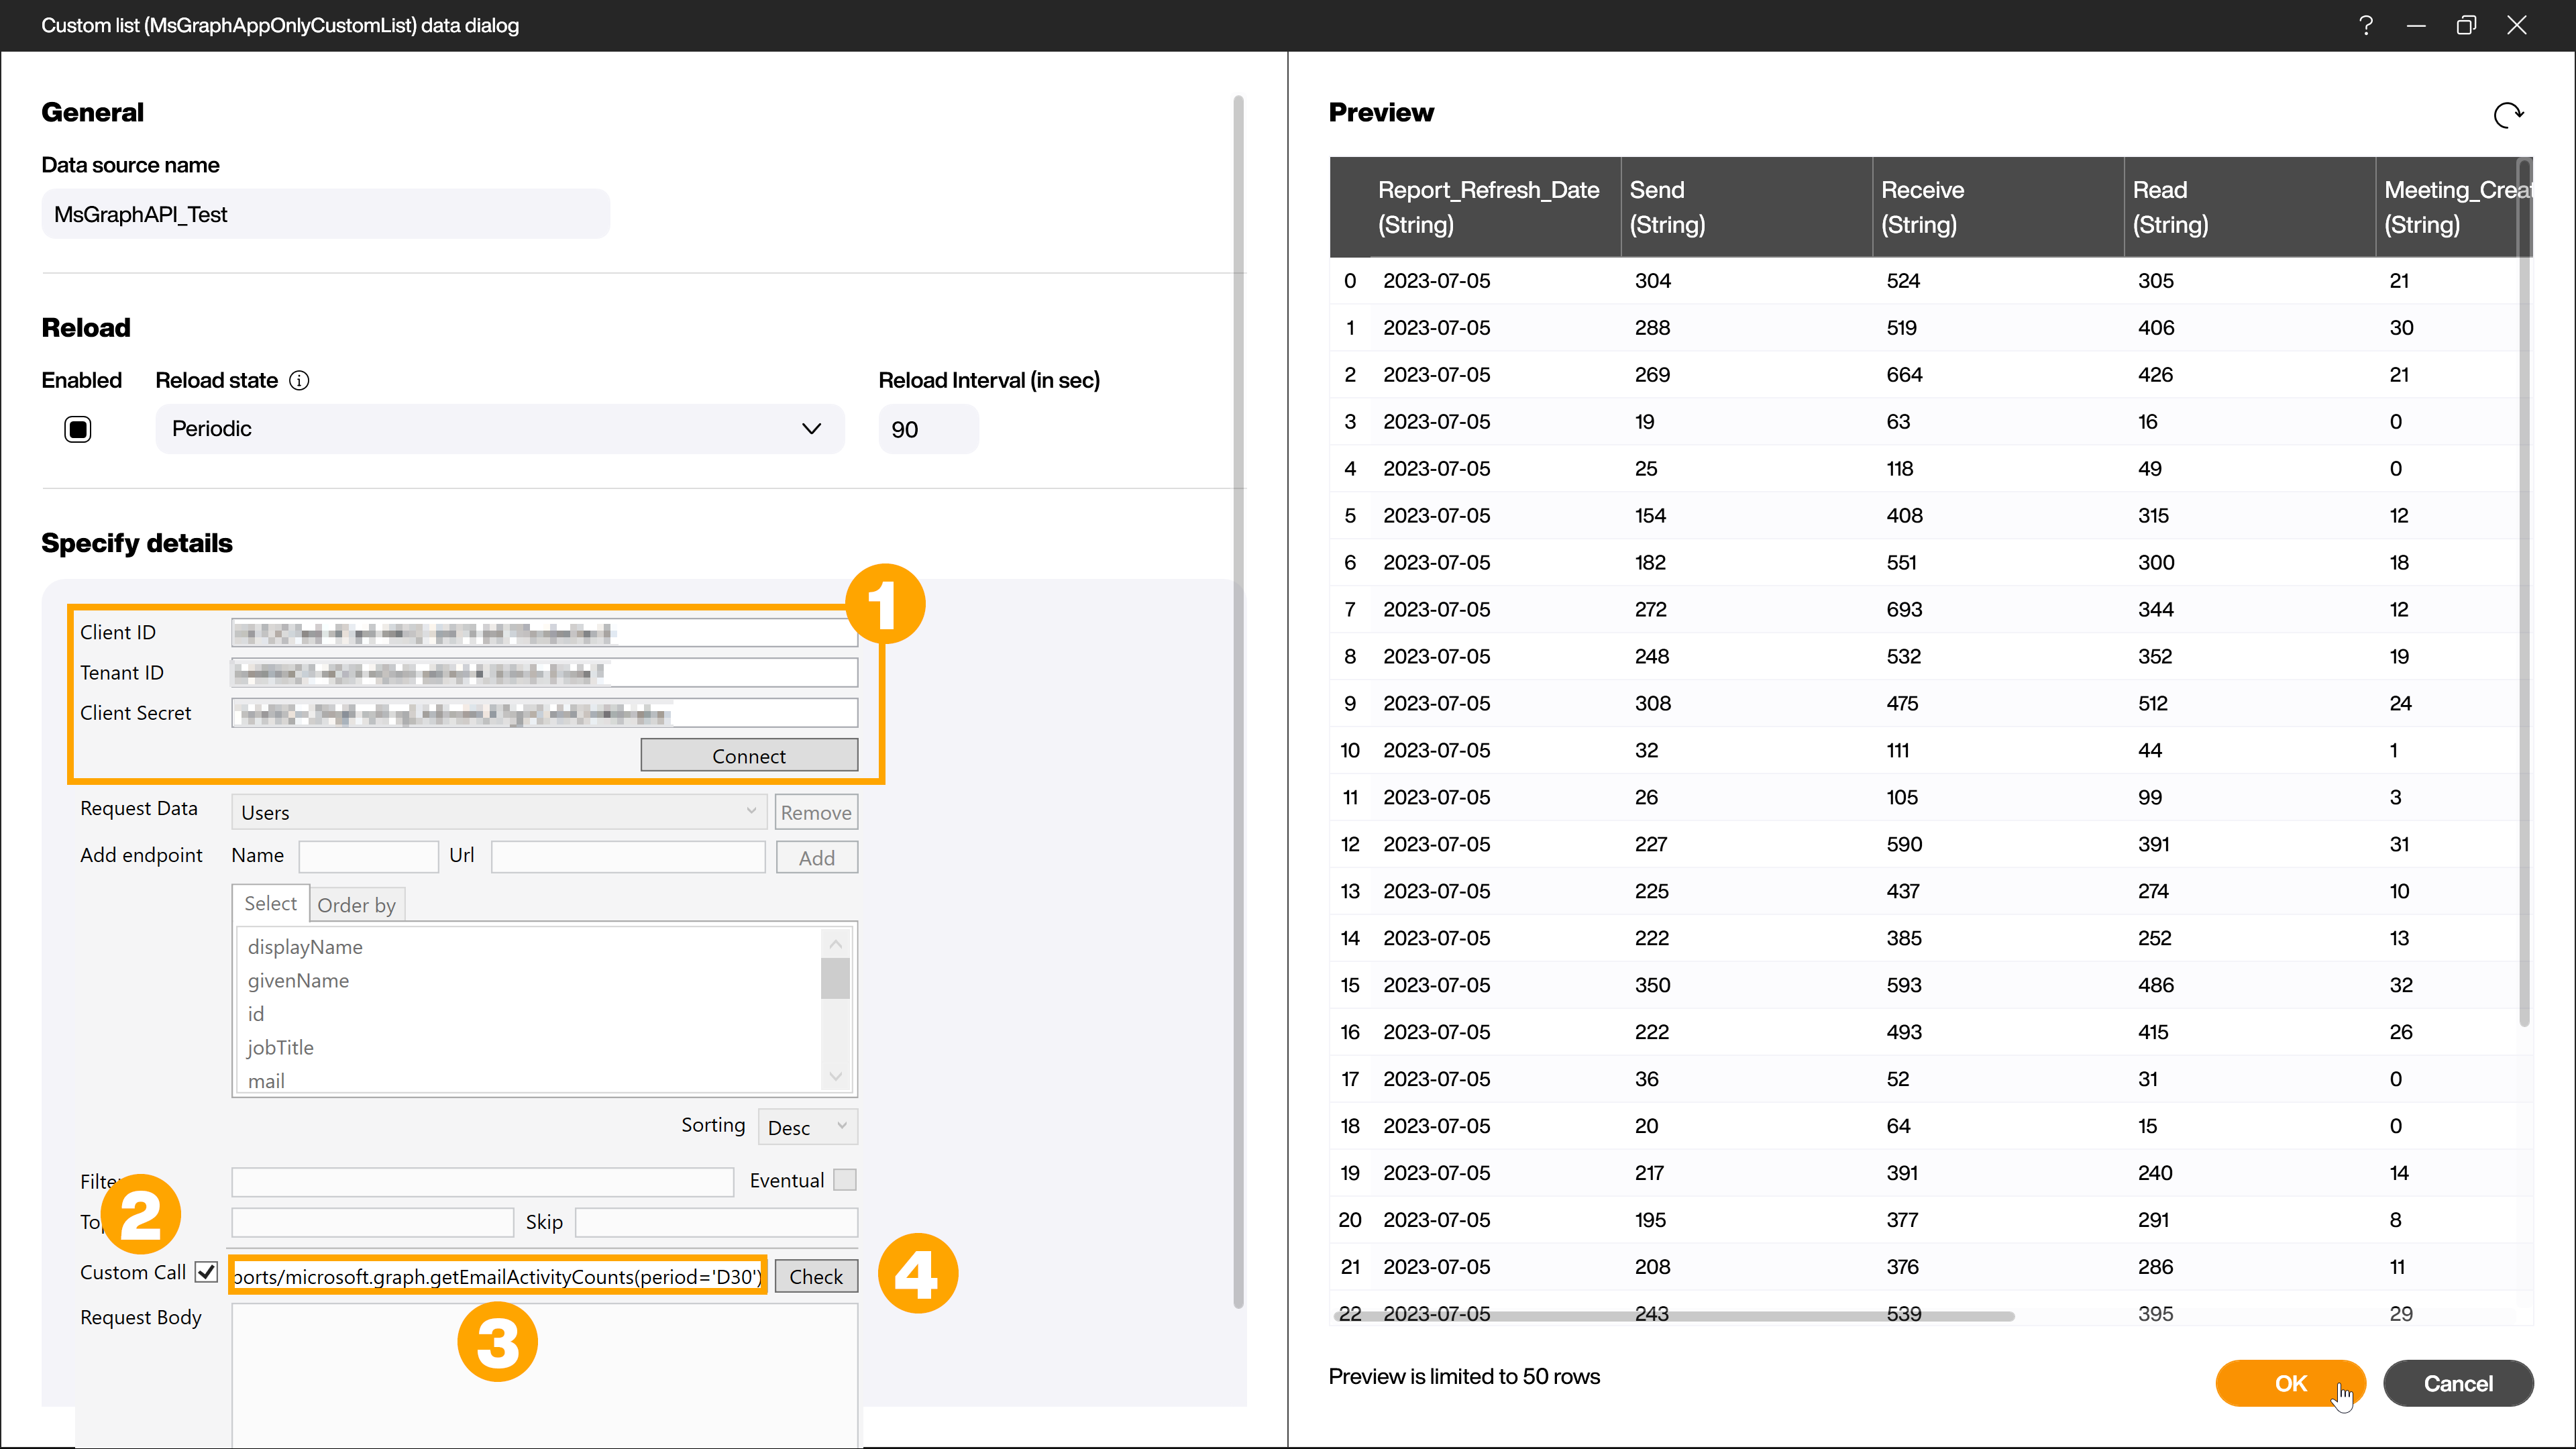
For the query, it is best to use the app-only access. Make sure that you have given the app the appropriate permission [Reports.Read.All]. First, give the data source a name. Enter your IDs and the client secret in the corresponding fields (1) and connect using the [Connect] button. Then check the [Custom Call] checkbox (2) and insert the URL for the report from Graph Explorer (3):
https://graph.microsoft.com/beta/reports/microsoft.graph.getEmailActivityCounts(period='D30')
With the additional parameter [period=’D30’] we retrieve the data of the last 30 days. Click on [Check] (4) to verify that the call is possible. After a positive confirmation, click on [Load data] in the right section to display a preview of the data.
Prepare data for use
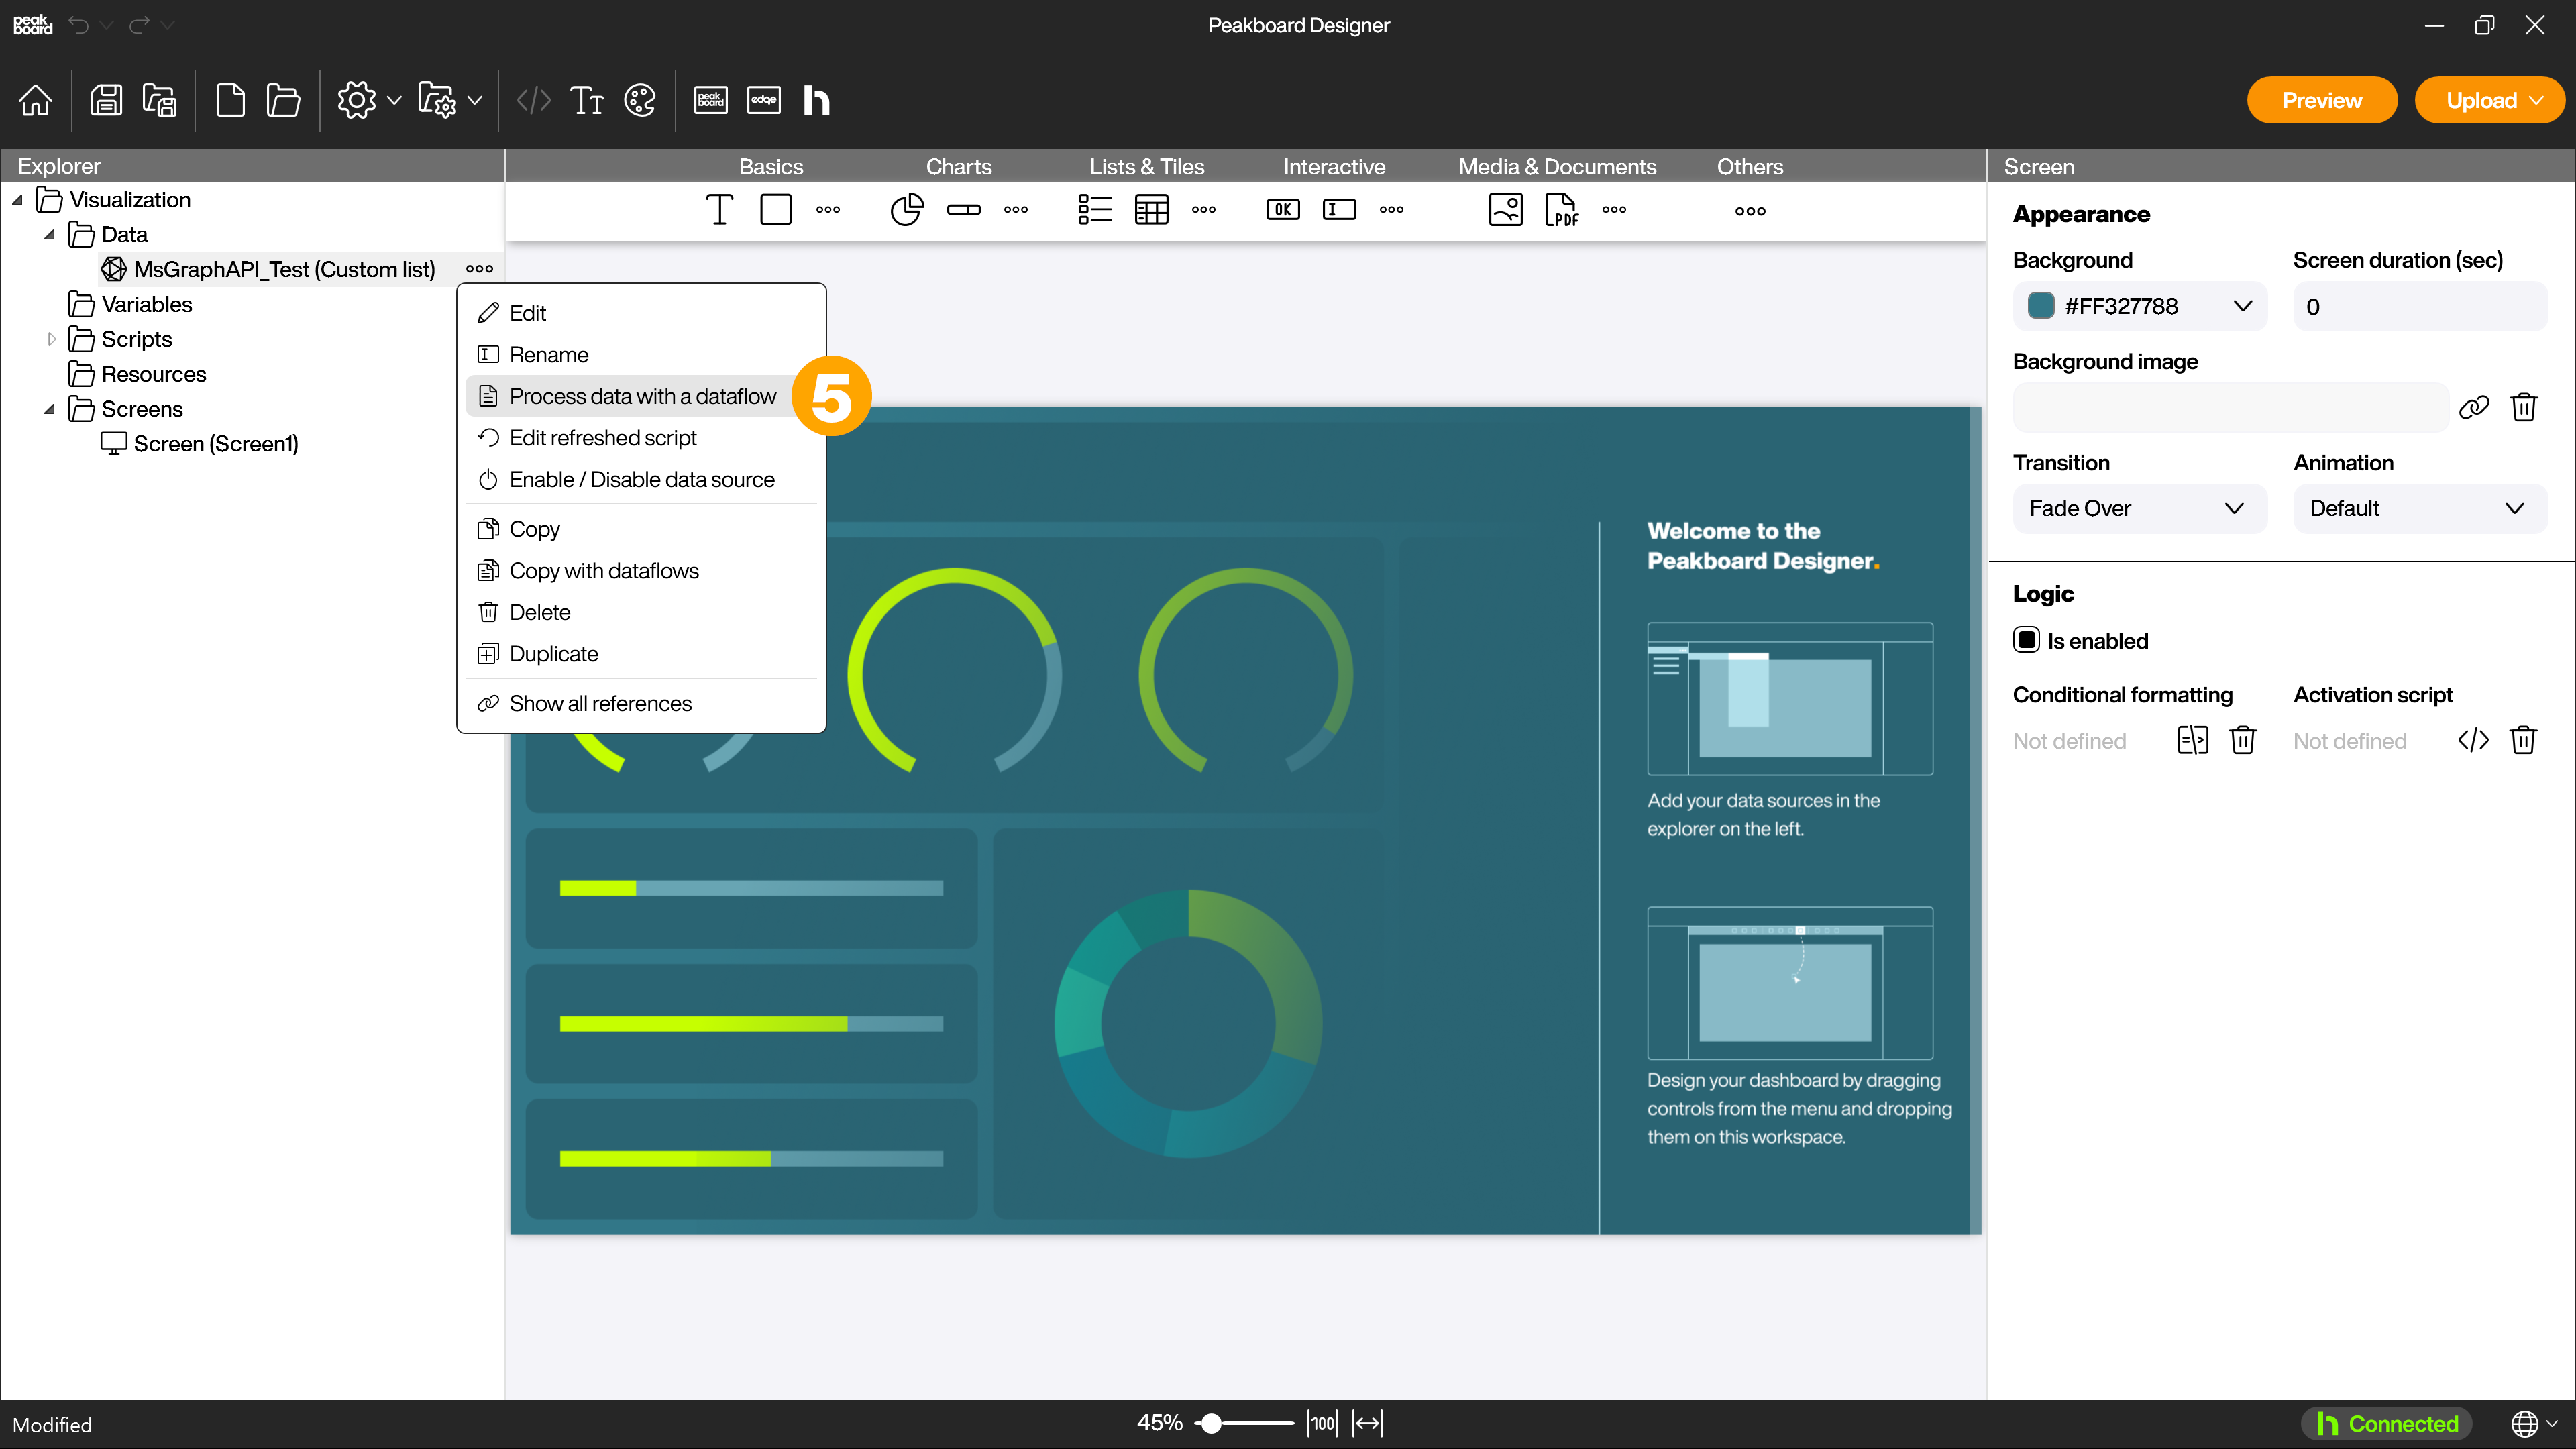
In case of reports, or all queries delivered in the form of a csv file, the data is delivered as a string. In this state it is difficult to process them in a chart. To prepare the data, create a dataflow on the data source (5).
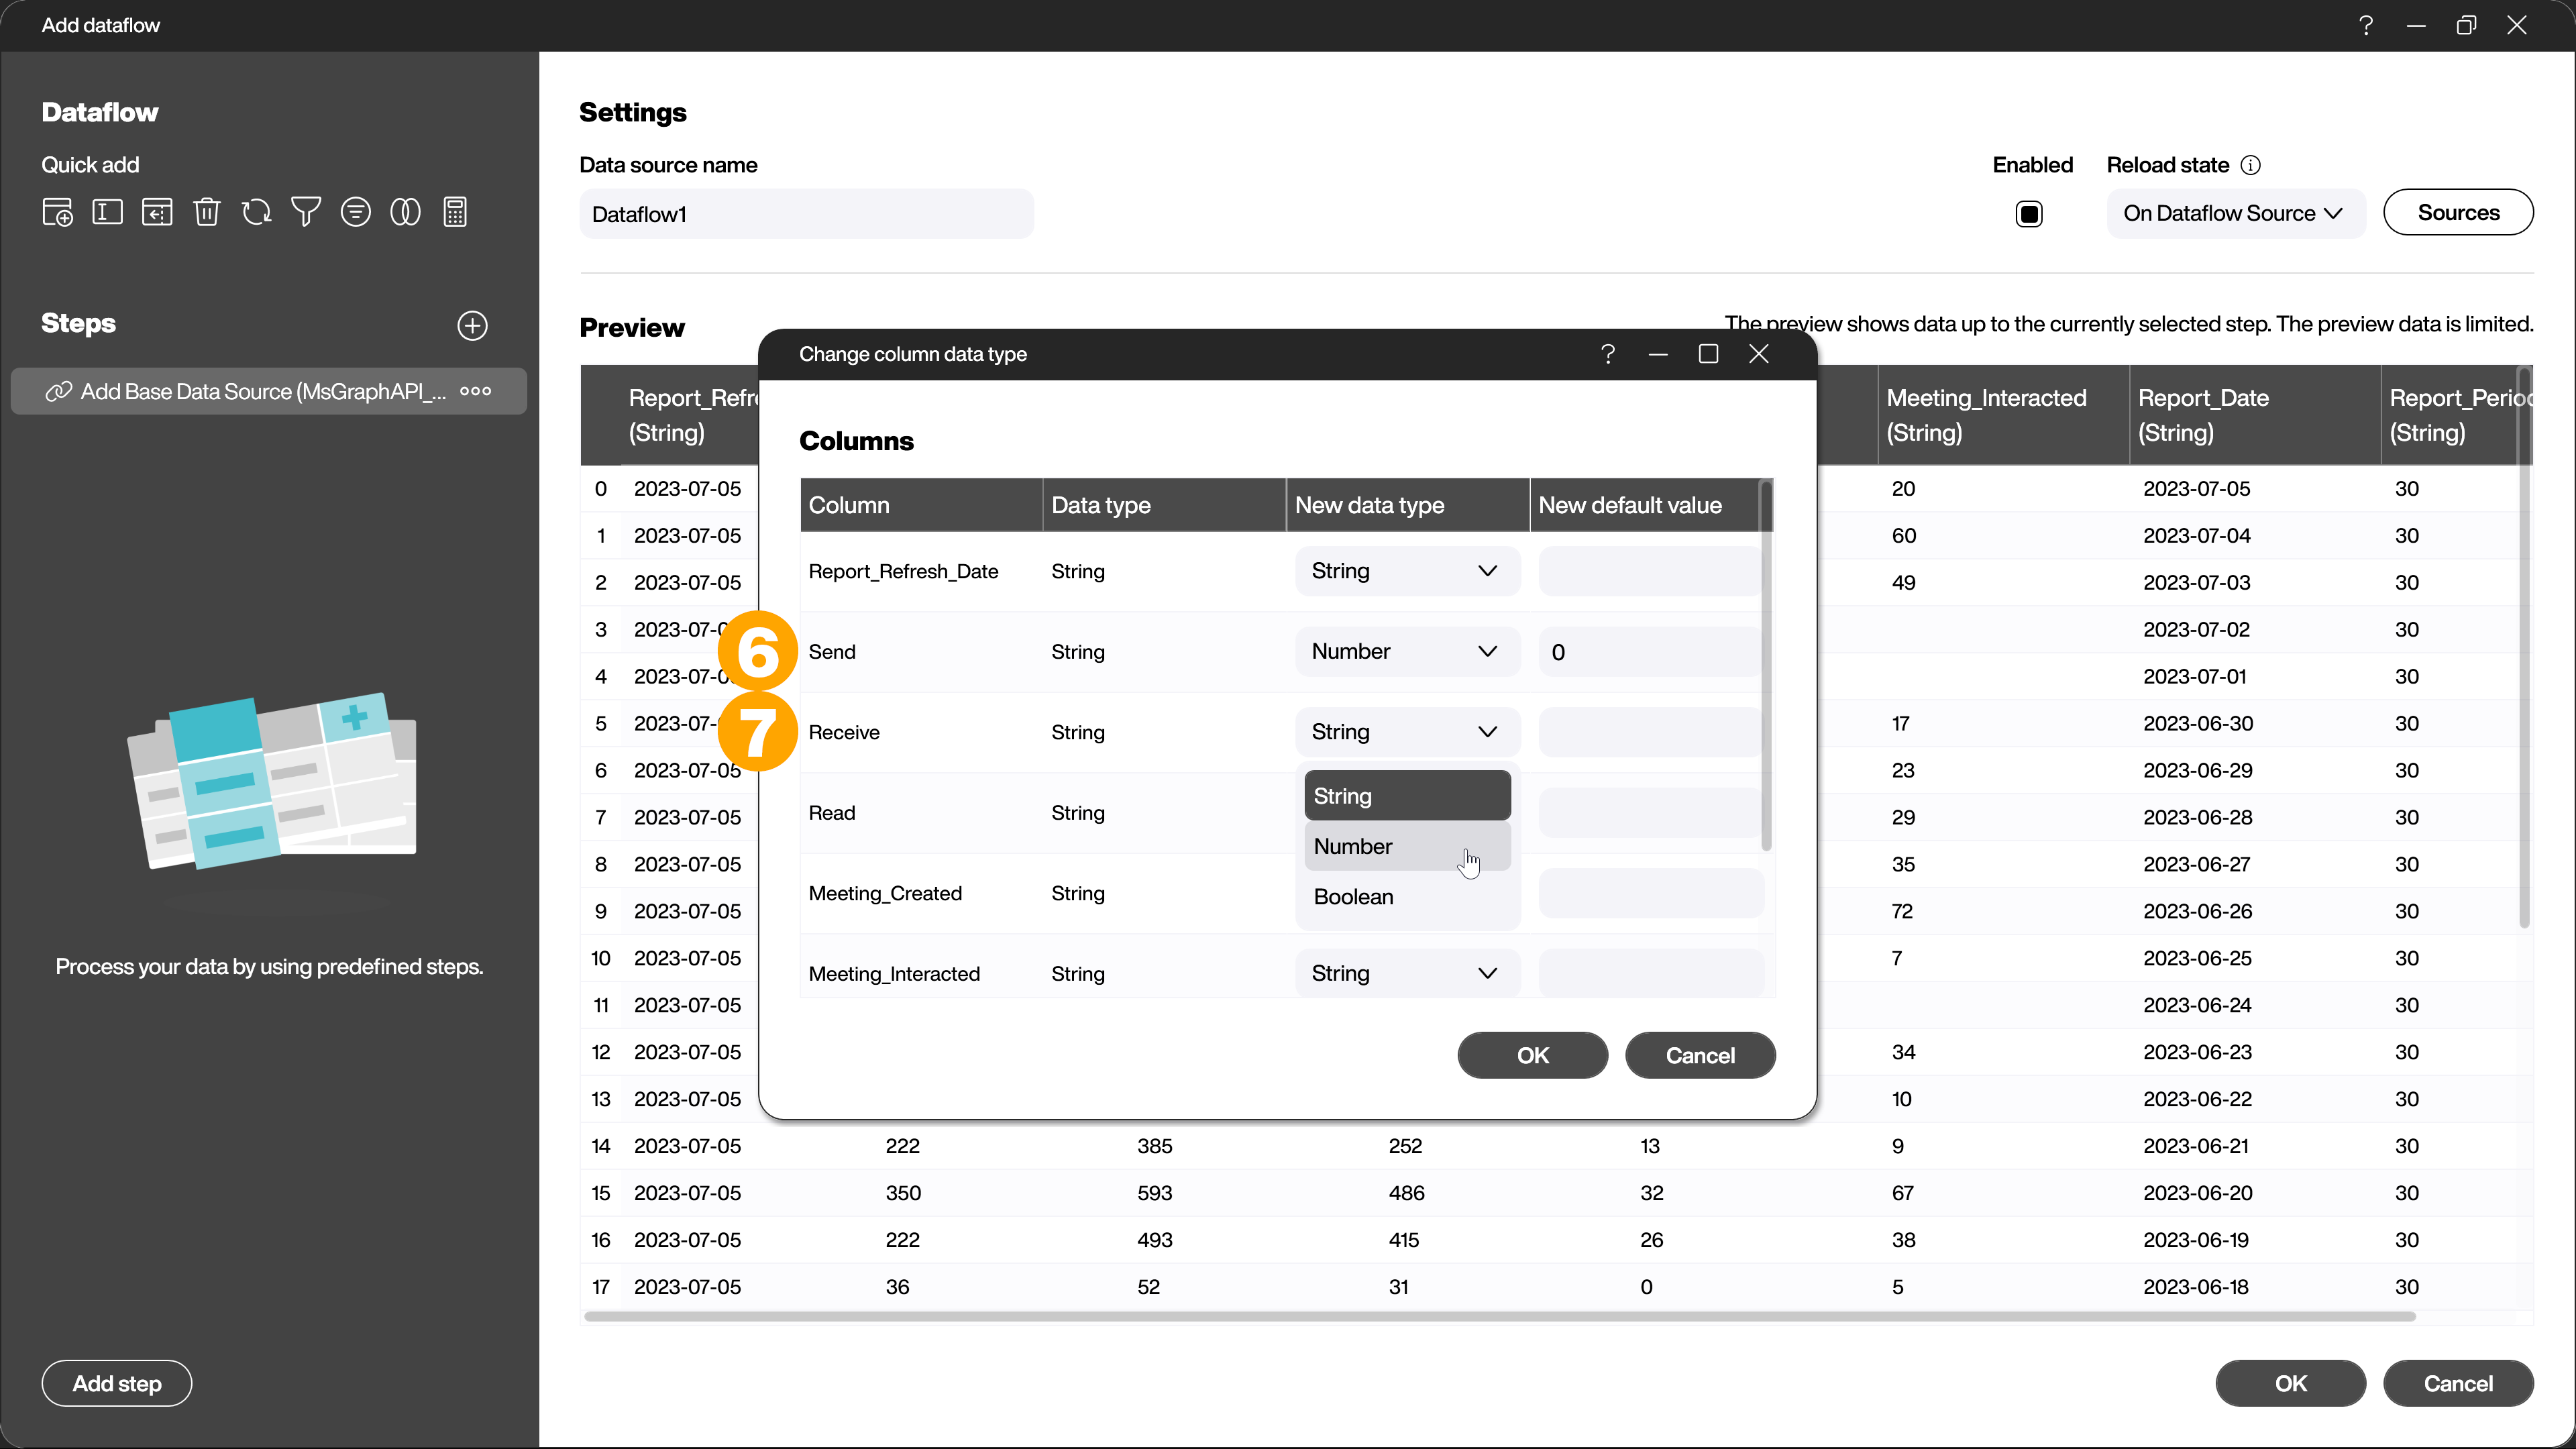
With this dataflow you convert the data type of the columns [Send] (6) and [Receive] (7) from string to number.
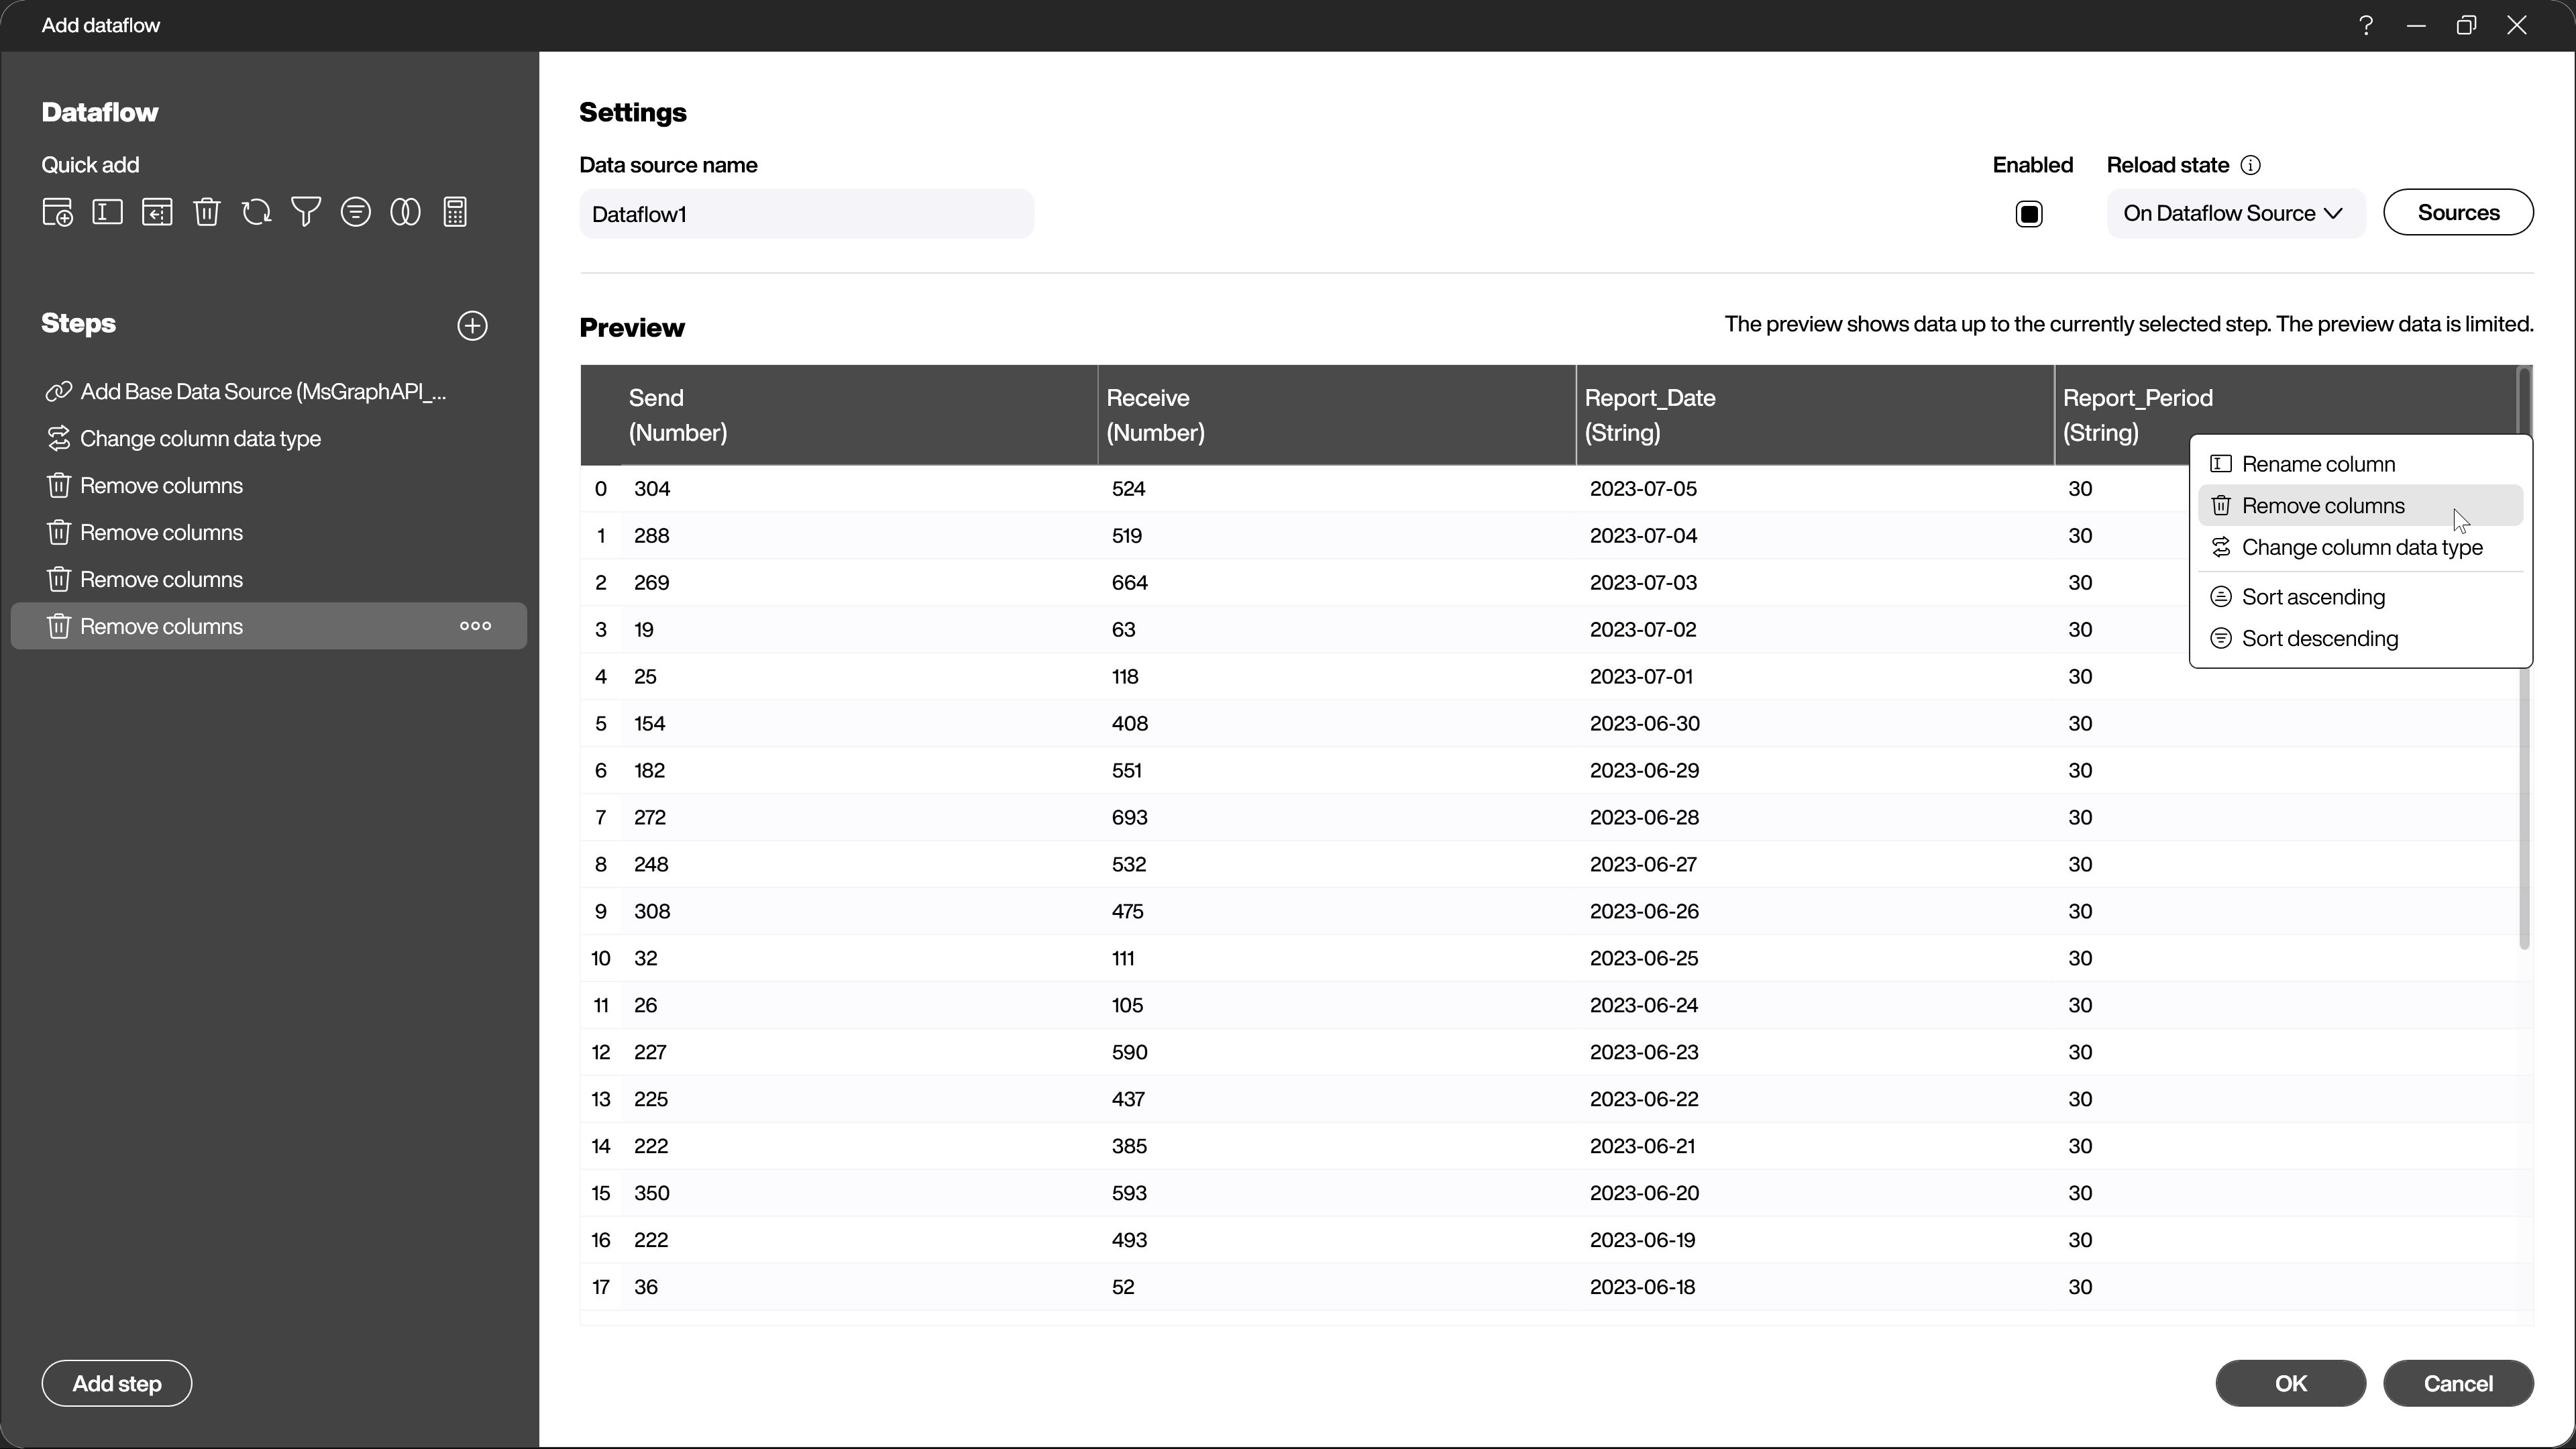
After that you delete all columns you don’t need, all except [Report_Date], [Send] and [Receive]. The data is now prepared for further use.
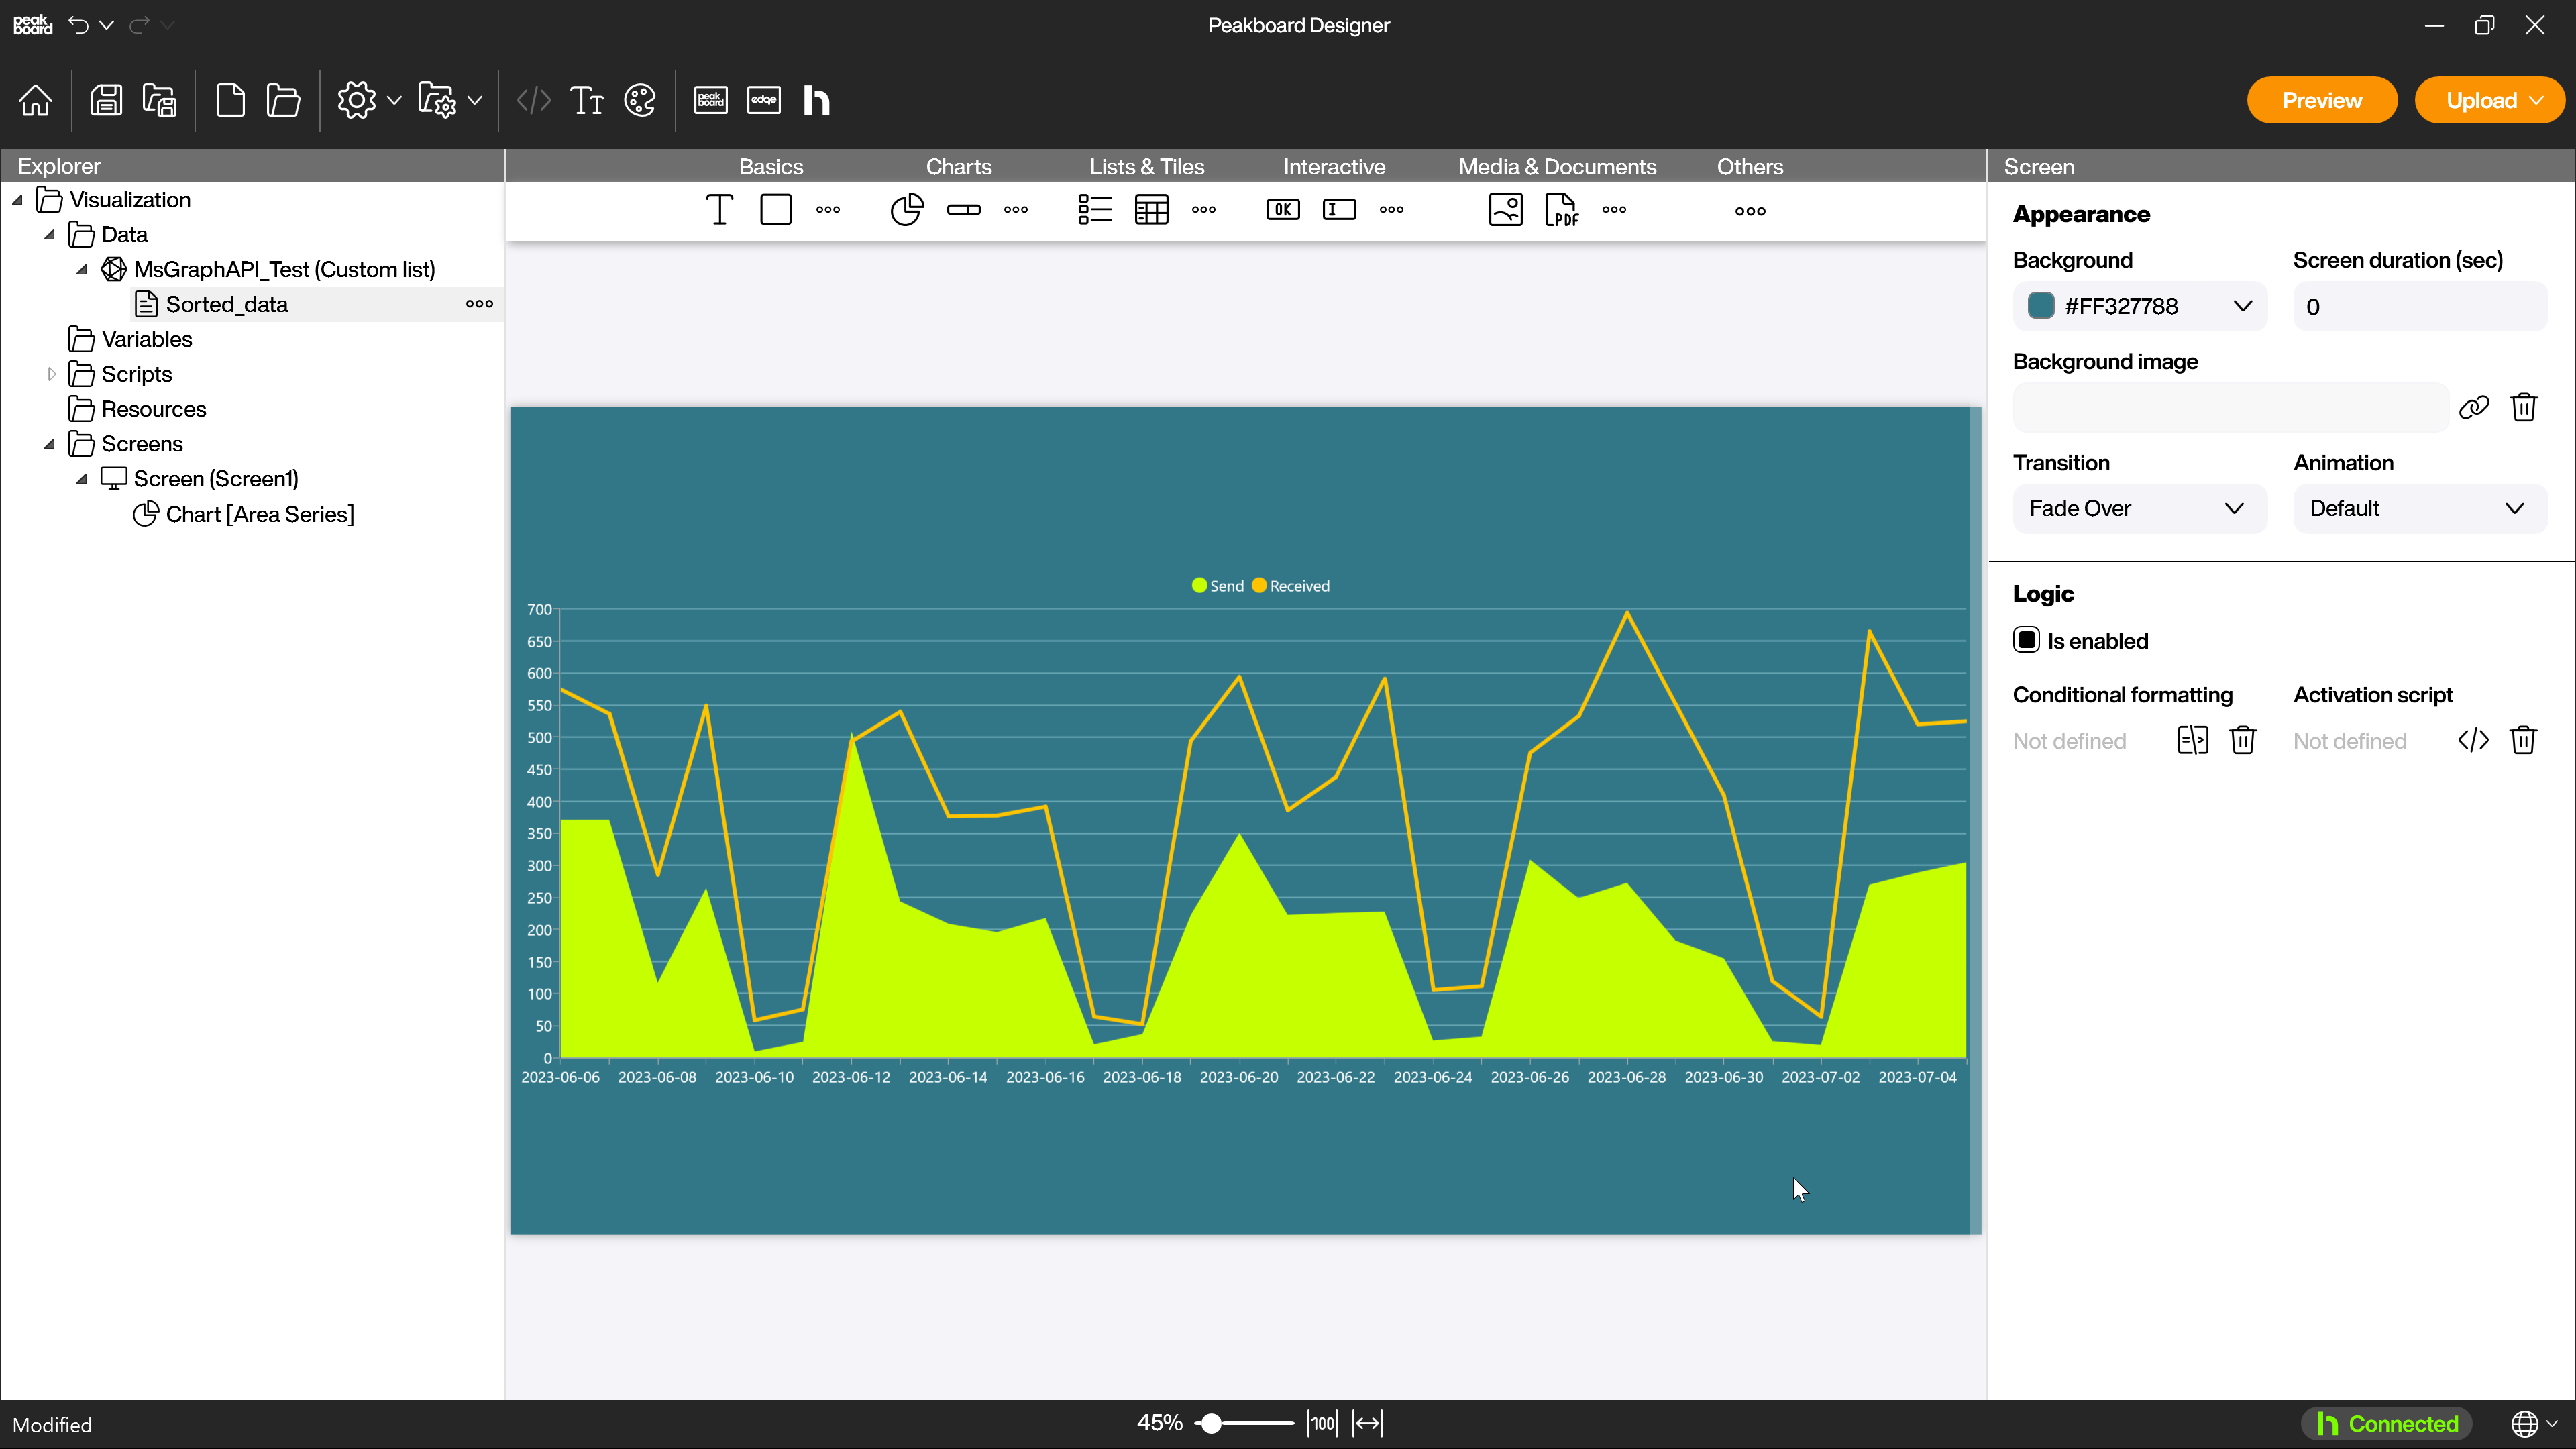
Create the chart
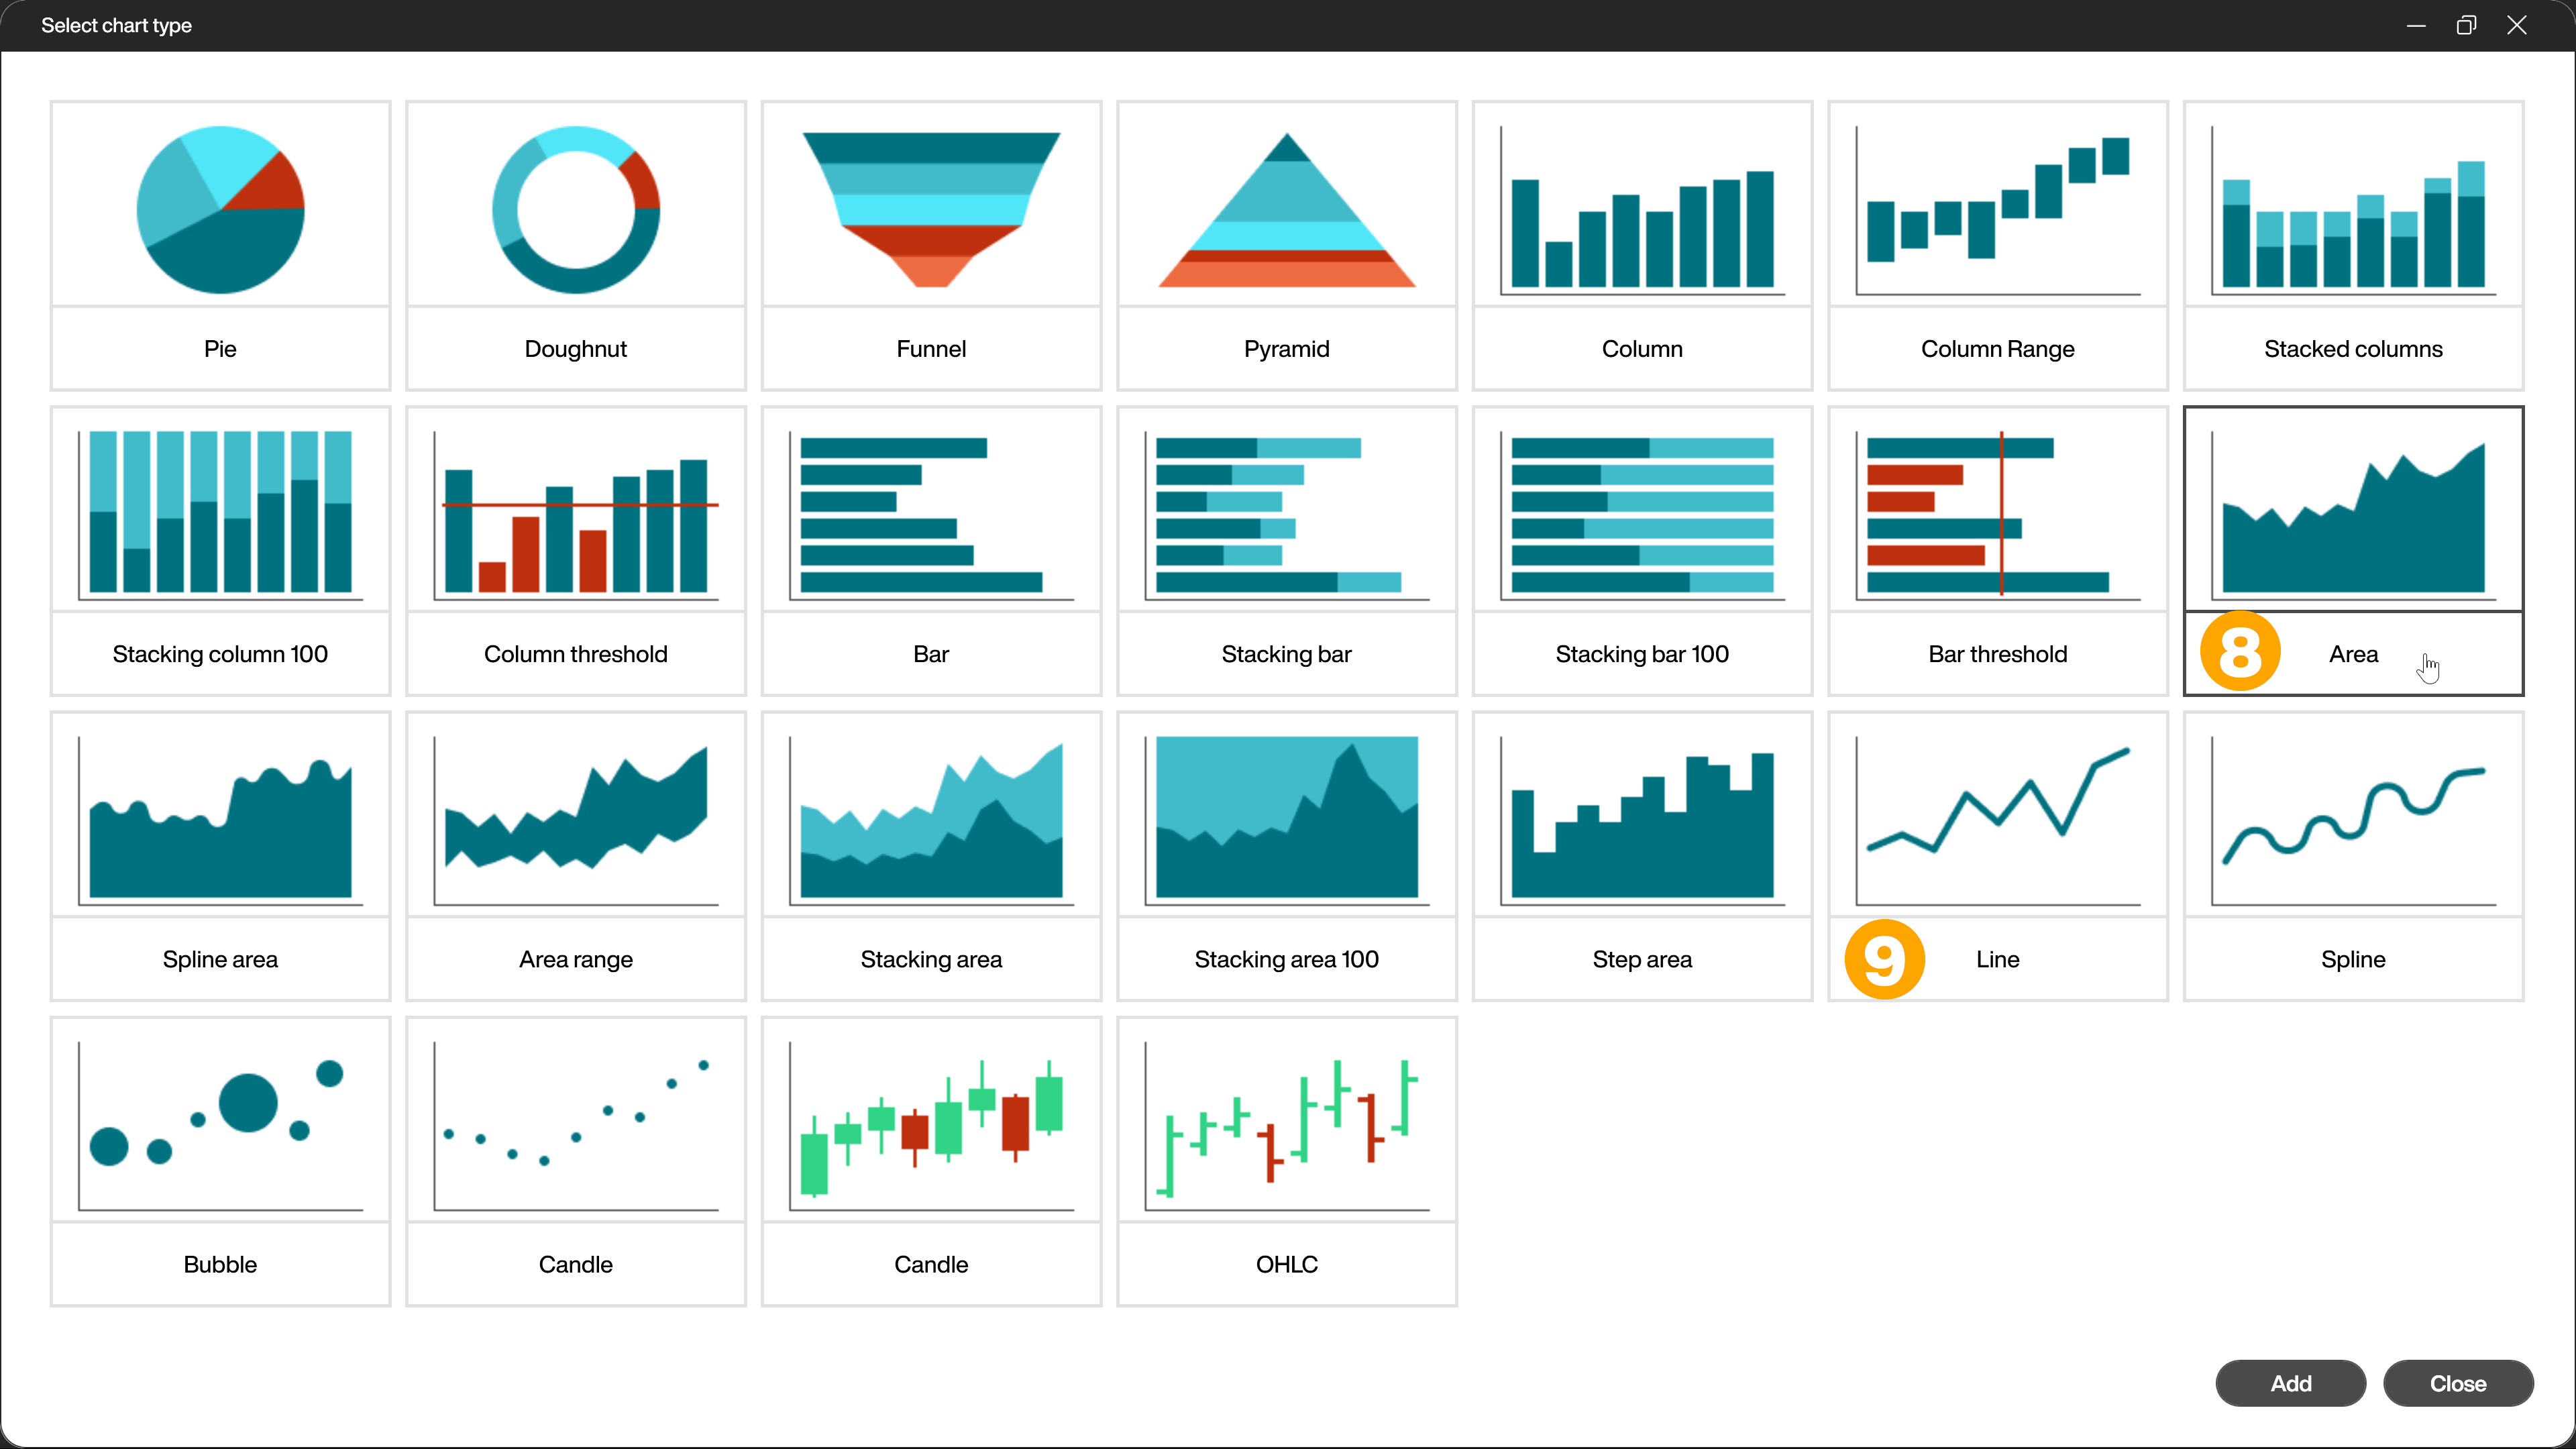
To display the data, a mixture of an area chart (8) for the sent e-mails and a line chart (9) for the received e-mails would be suitable, for example.
The x-axis is always the date. The rest of the configuration is self-explanatory and easy to do thanks to the well-prepared data.
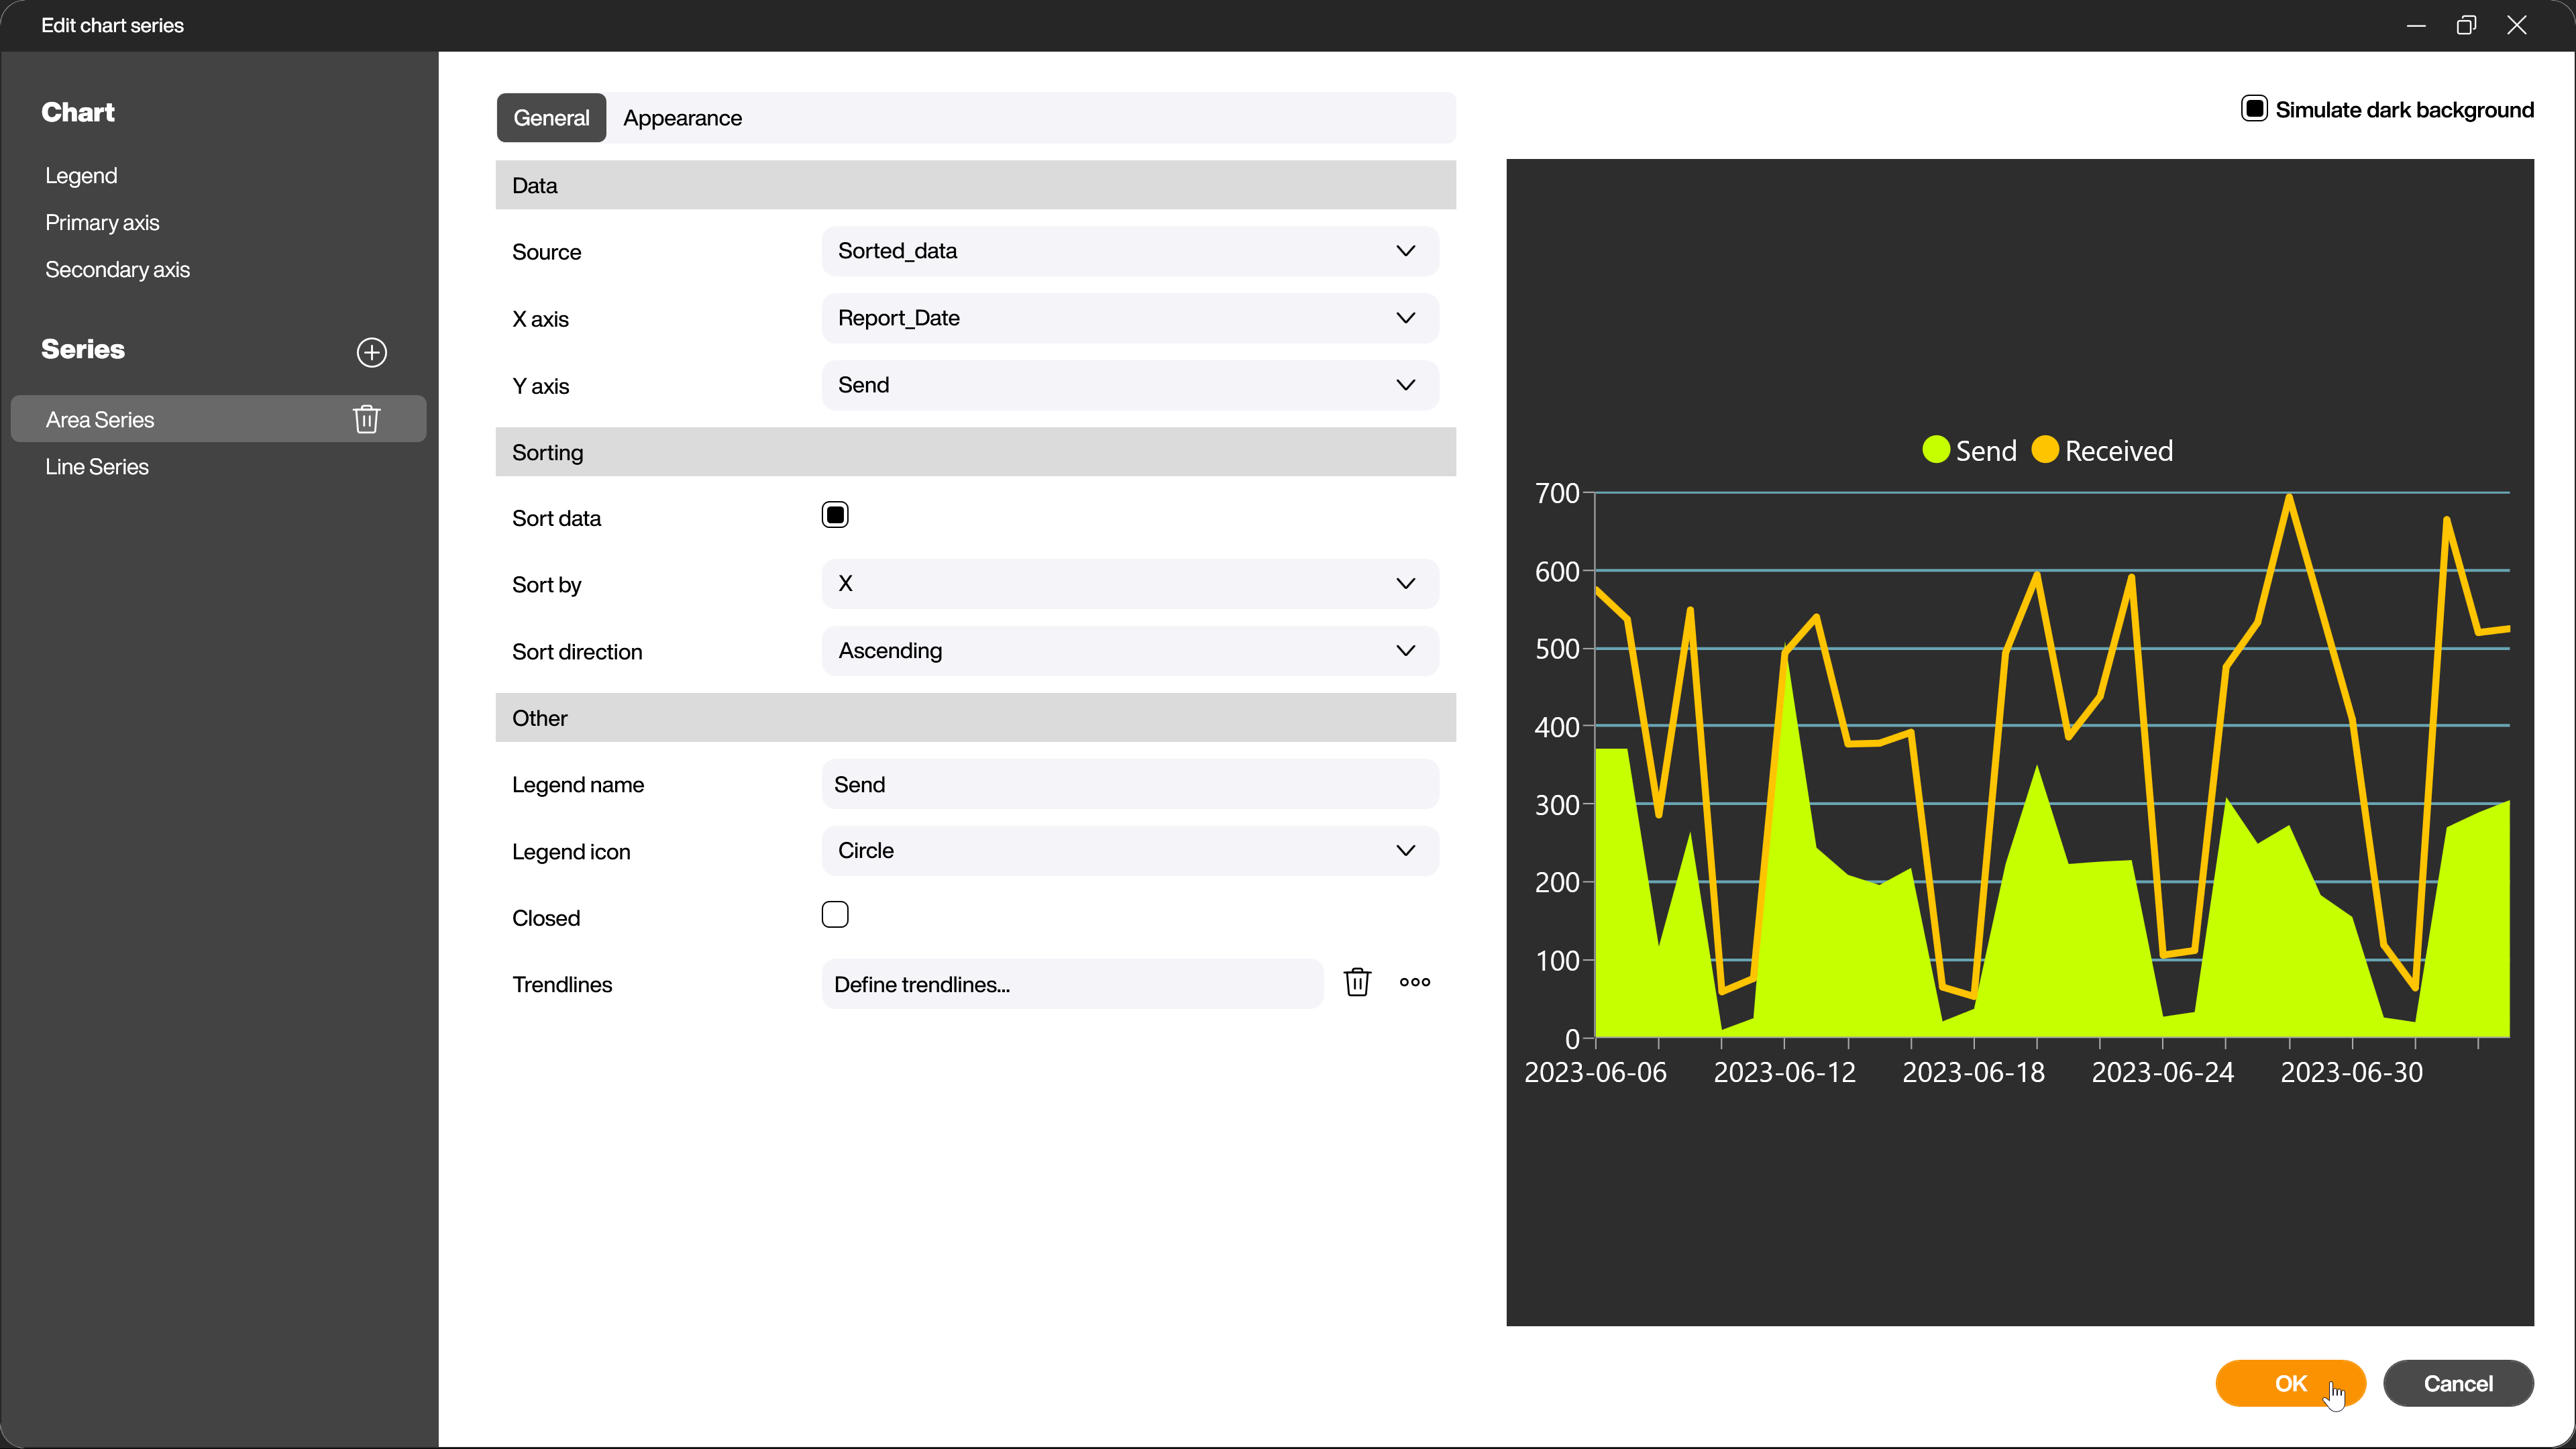
If everything worked, the result should look something like this