Get started
The Peakboard Designer
The Peakboard Designer is a desktop application for Windows computers that you can download here. You may need installation permissions from your system administrator to install it.
In this article we will give you a first overview of Peakboard Designer. In the following articles you will create your first visualization and transfer it to your Peakboard Box. Our video tutorials also offer you further assistance, feel free to have a look around.
1. Welcome to the Peakboard Designer
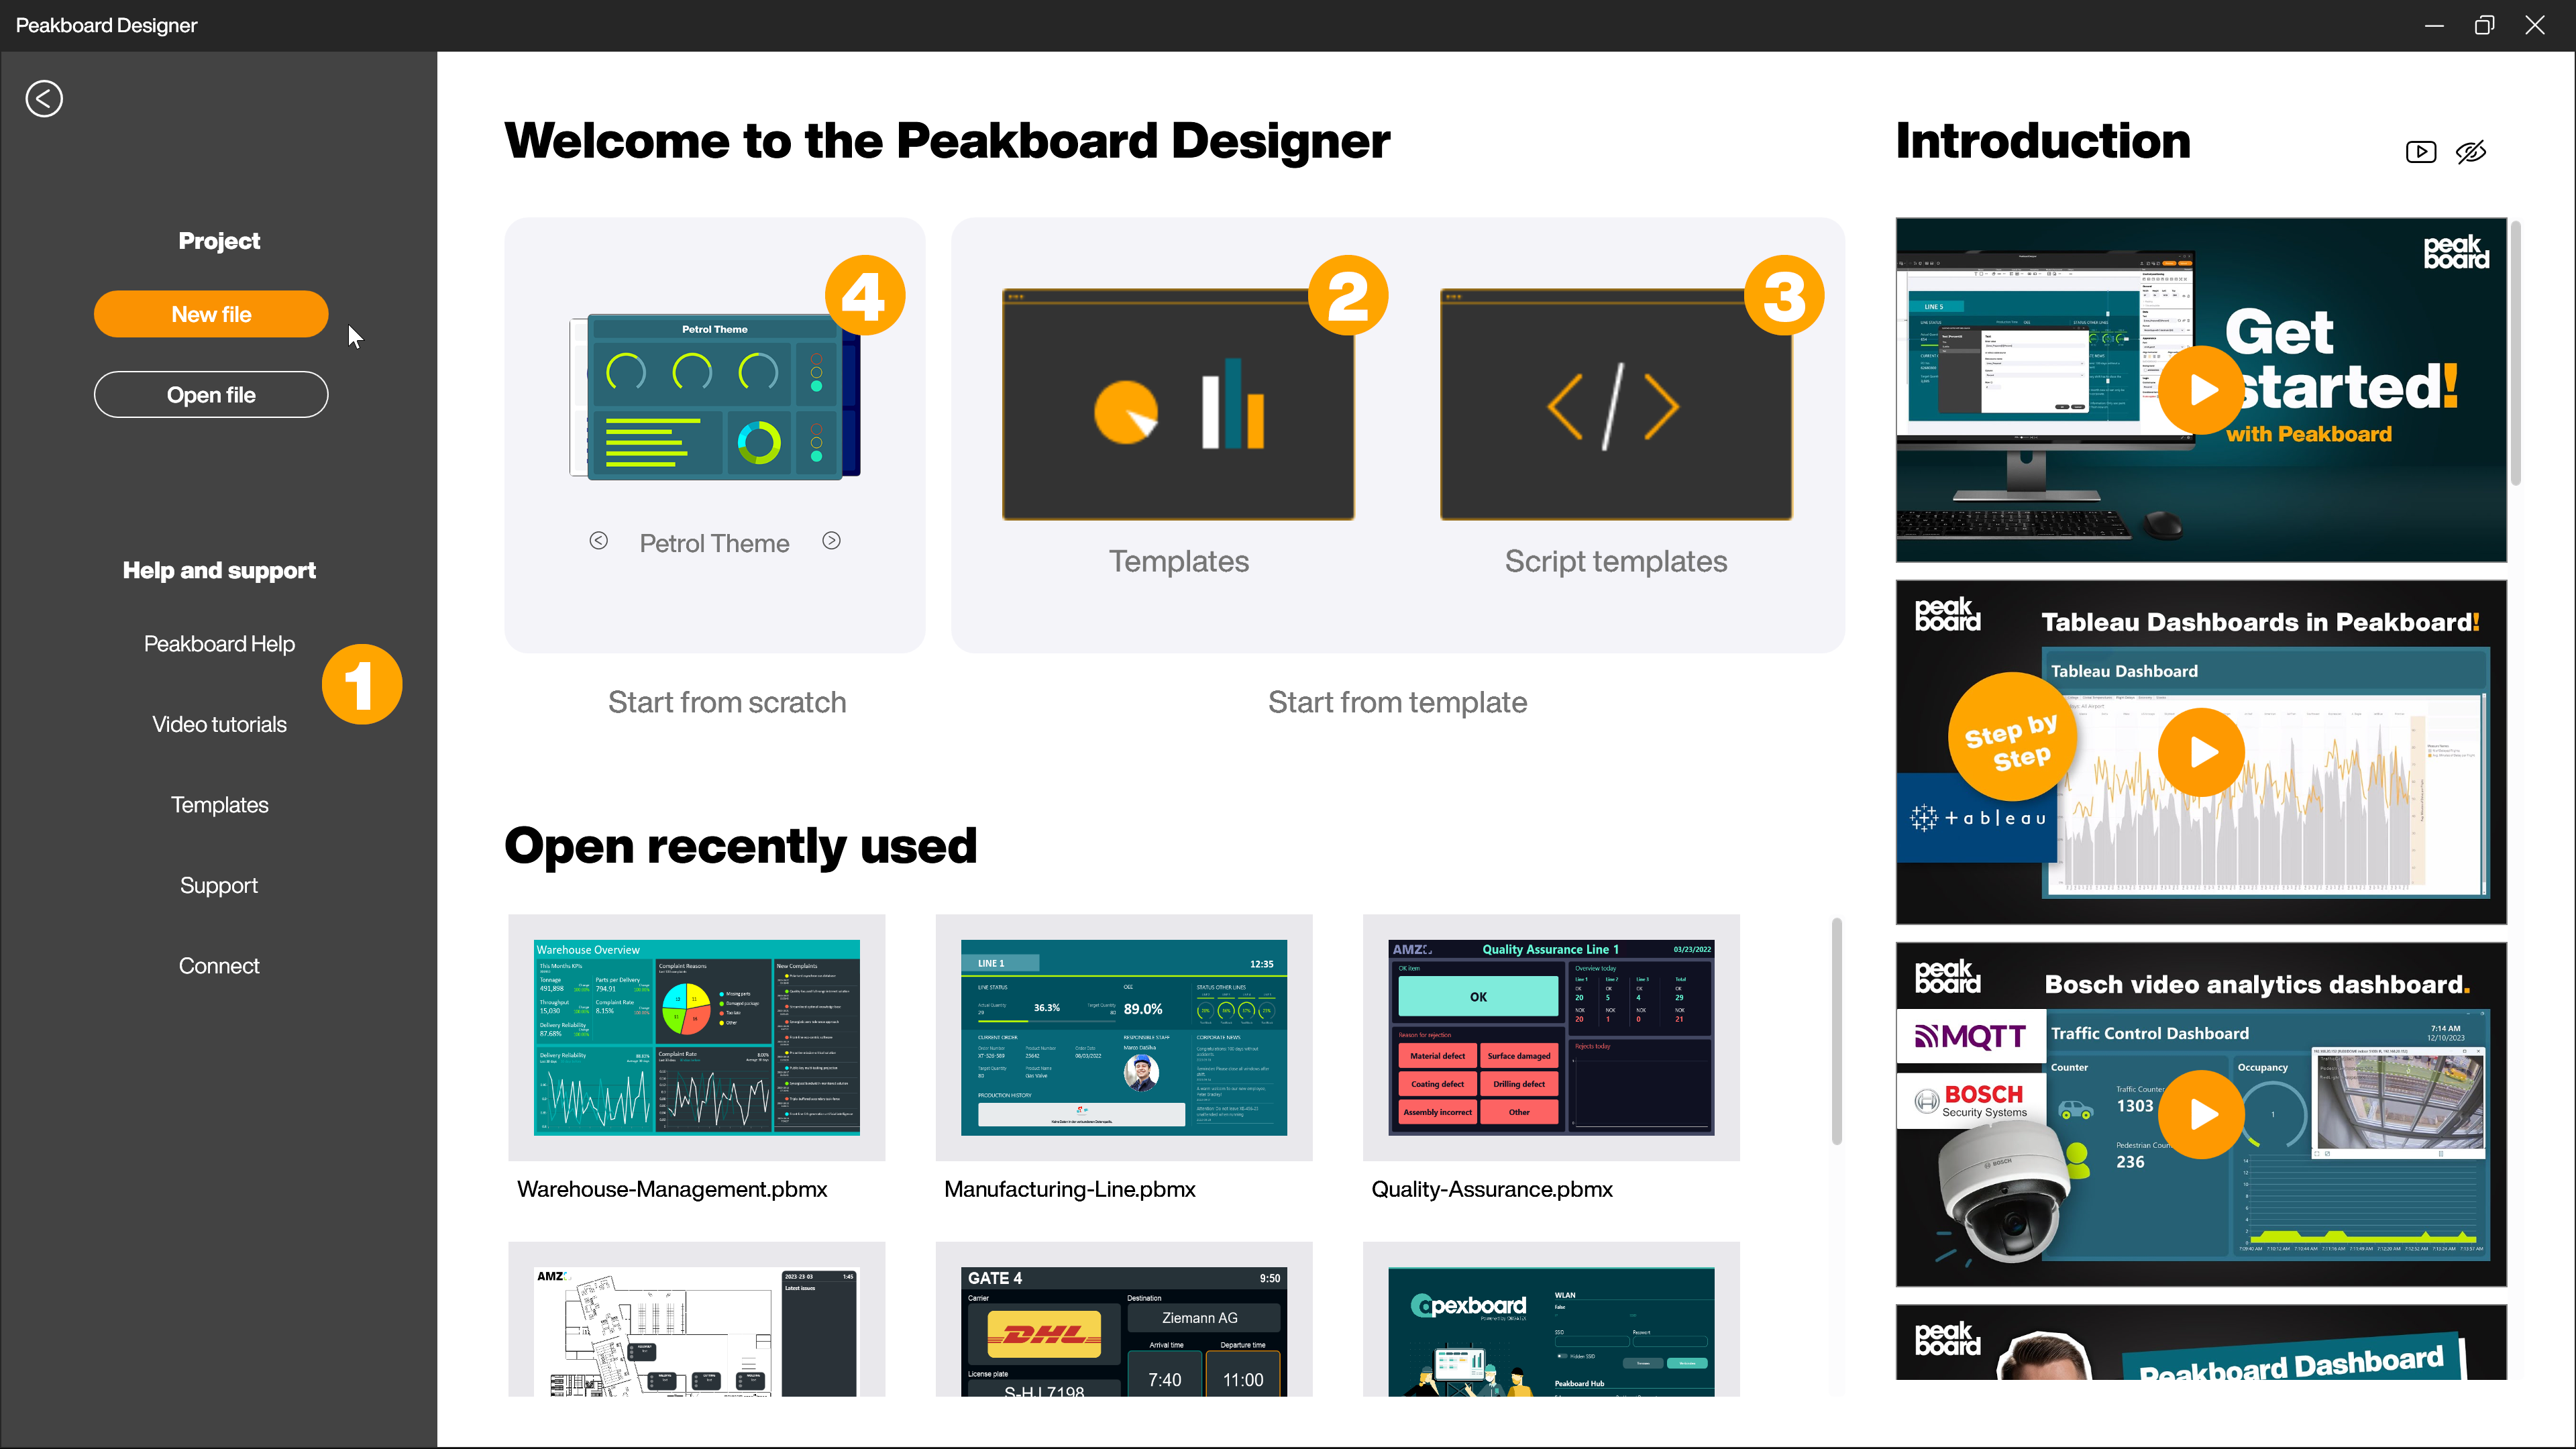
After opening Peakboard Designer for the first time, you will find yourself in the start dialog. Here you will find useful links to the Peakboard Help (1) or the video tutorials. Via the button [Templates] (2) you will find some templates, which should make the start as easy as possible. The templates serve as examples and can be used as a basis for your individual visualization. The button [Script templates] (3) gives you access to templates for different use cases and example files that explain how to work with scripts. To start your visualization without a template, select one of the themes from the theme slider in the [Start from scratch] section (4). You can always change the selected theme later if you don’t like it. Alternatively, click [New file] in the left pane and the petrol theme will be automatically selected, opening an empty file. To change the display language, click on the country flag at the bottom left (5).
2. The structure of the Peakboard Designer
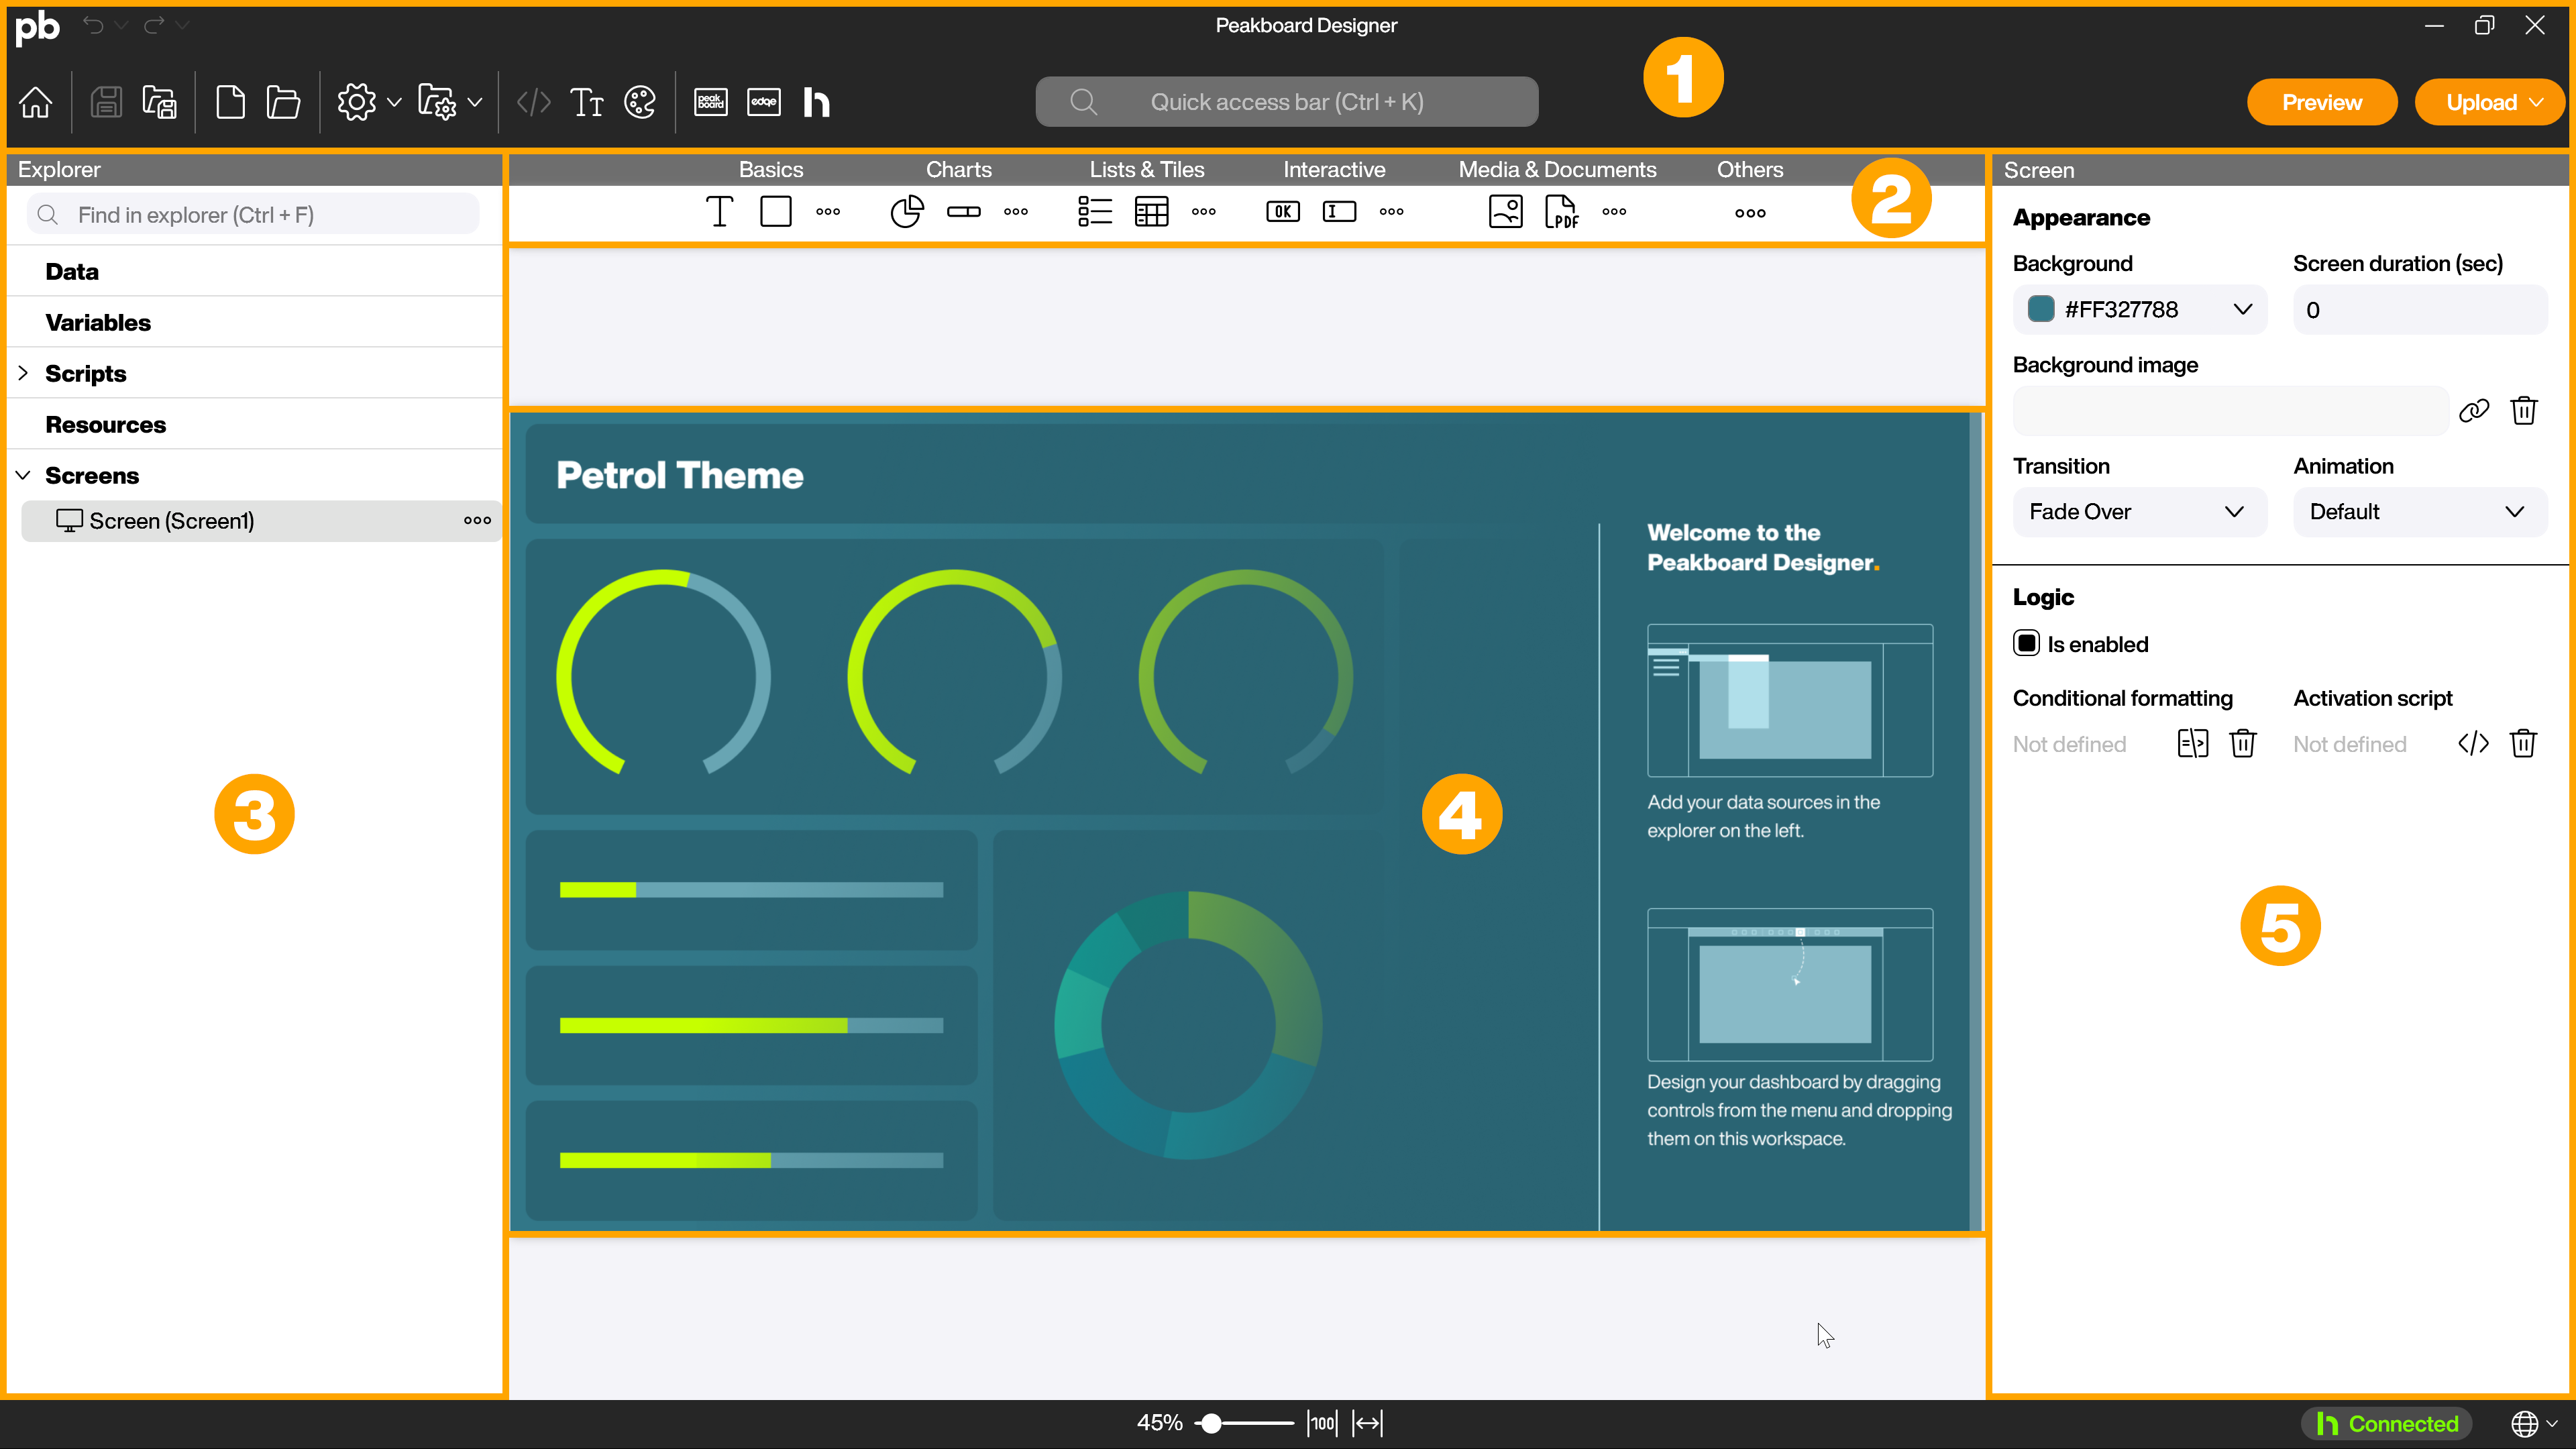
Now you’ve really arrived at the Peakboard Designer. The Peakboard Designer is divided into five main areas. At the top is the menu bar (1), directly below it you will find the various controls (2), on the left you’ll find the explorer (3), the workspace is in the middle (4) and on the right you’ll find the attributes (5).
2.1 The menu bar
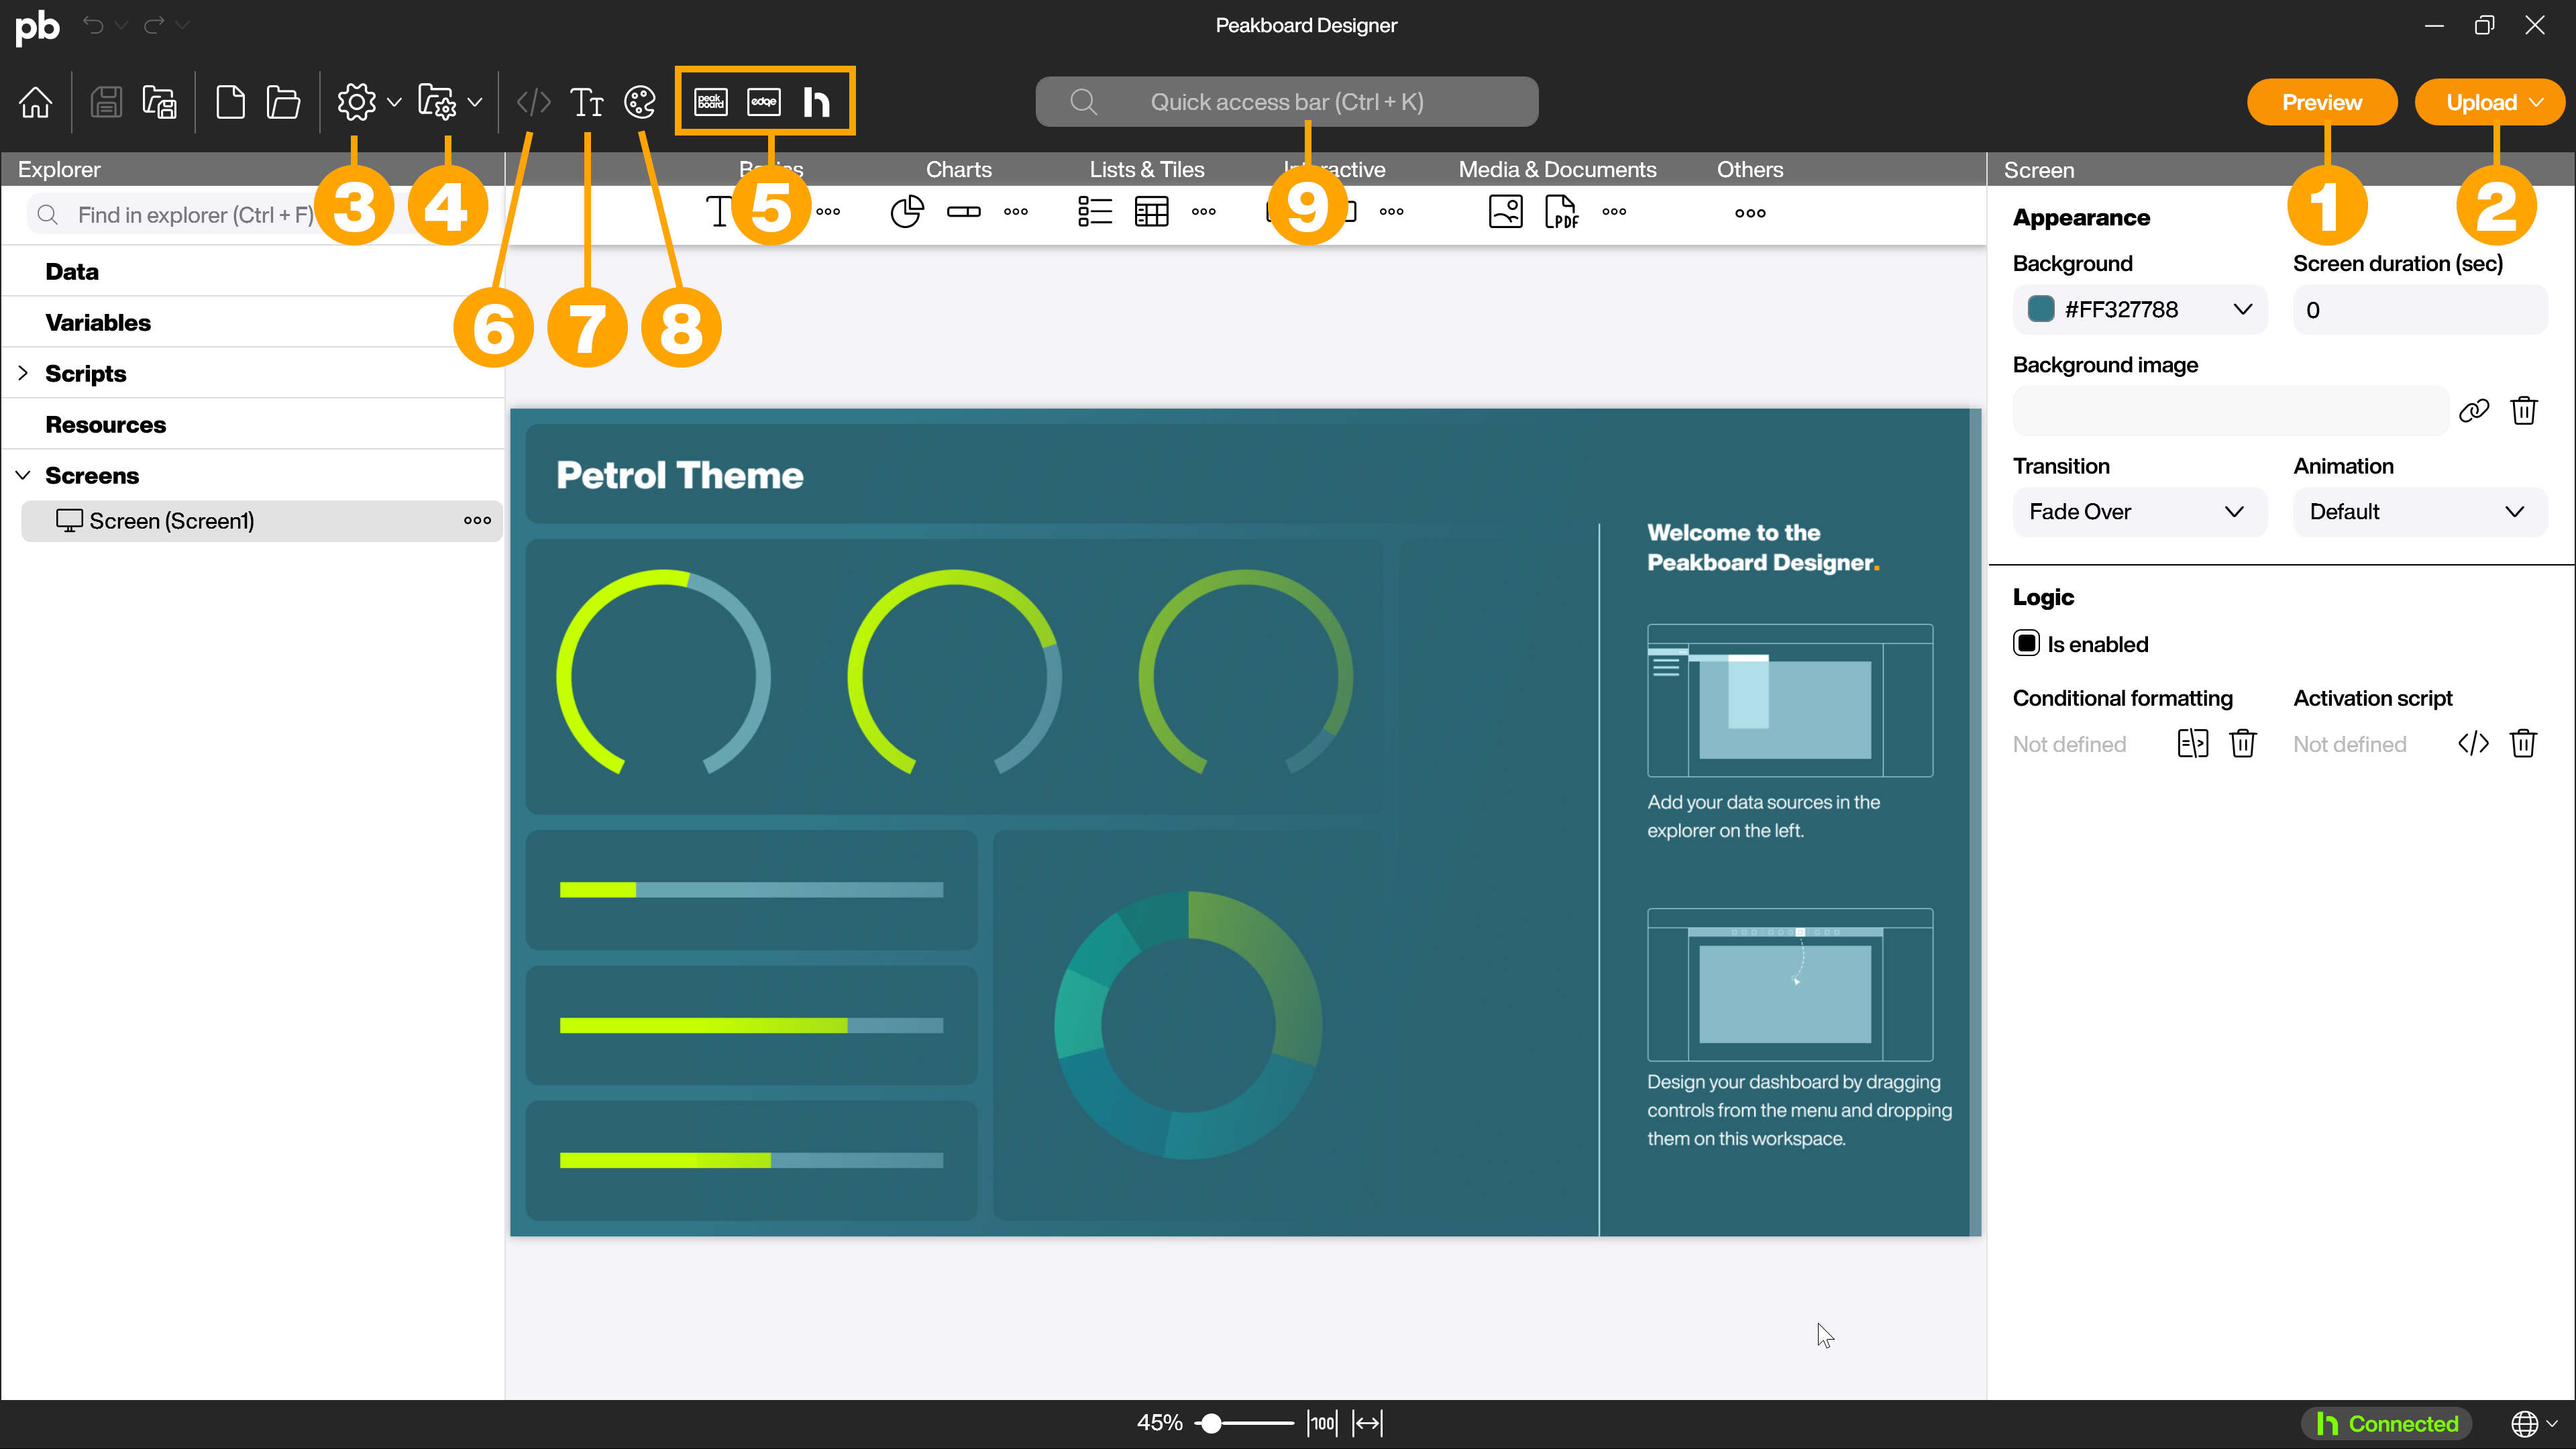
You can open a preview of your visualization (1) or load it onto your Peakboard Box (2). With the button [General] (3) you can for example perform a software update and with the button [Project] (4) you can make basic settings for your visualization. You can also manage your Peakboard Boxes, Peakboard Edge and Peakboard Hub via the corresponding buttons (5). In addition, you will find access to the script editor (6), the fonts (7) and the project colors (8) in the menu bar. In the middle of the menu bar you will find the quick access bar (9). Clicking on the Peakbot symbol (10) opens it and allows you to talk to it about open questions you may have. At the bottom of the Peakboard Designer you will find a button with a country flag (11) to switch the language between German and English, as well as some zoom controls (12).
2.2 The explorer
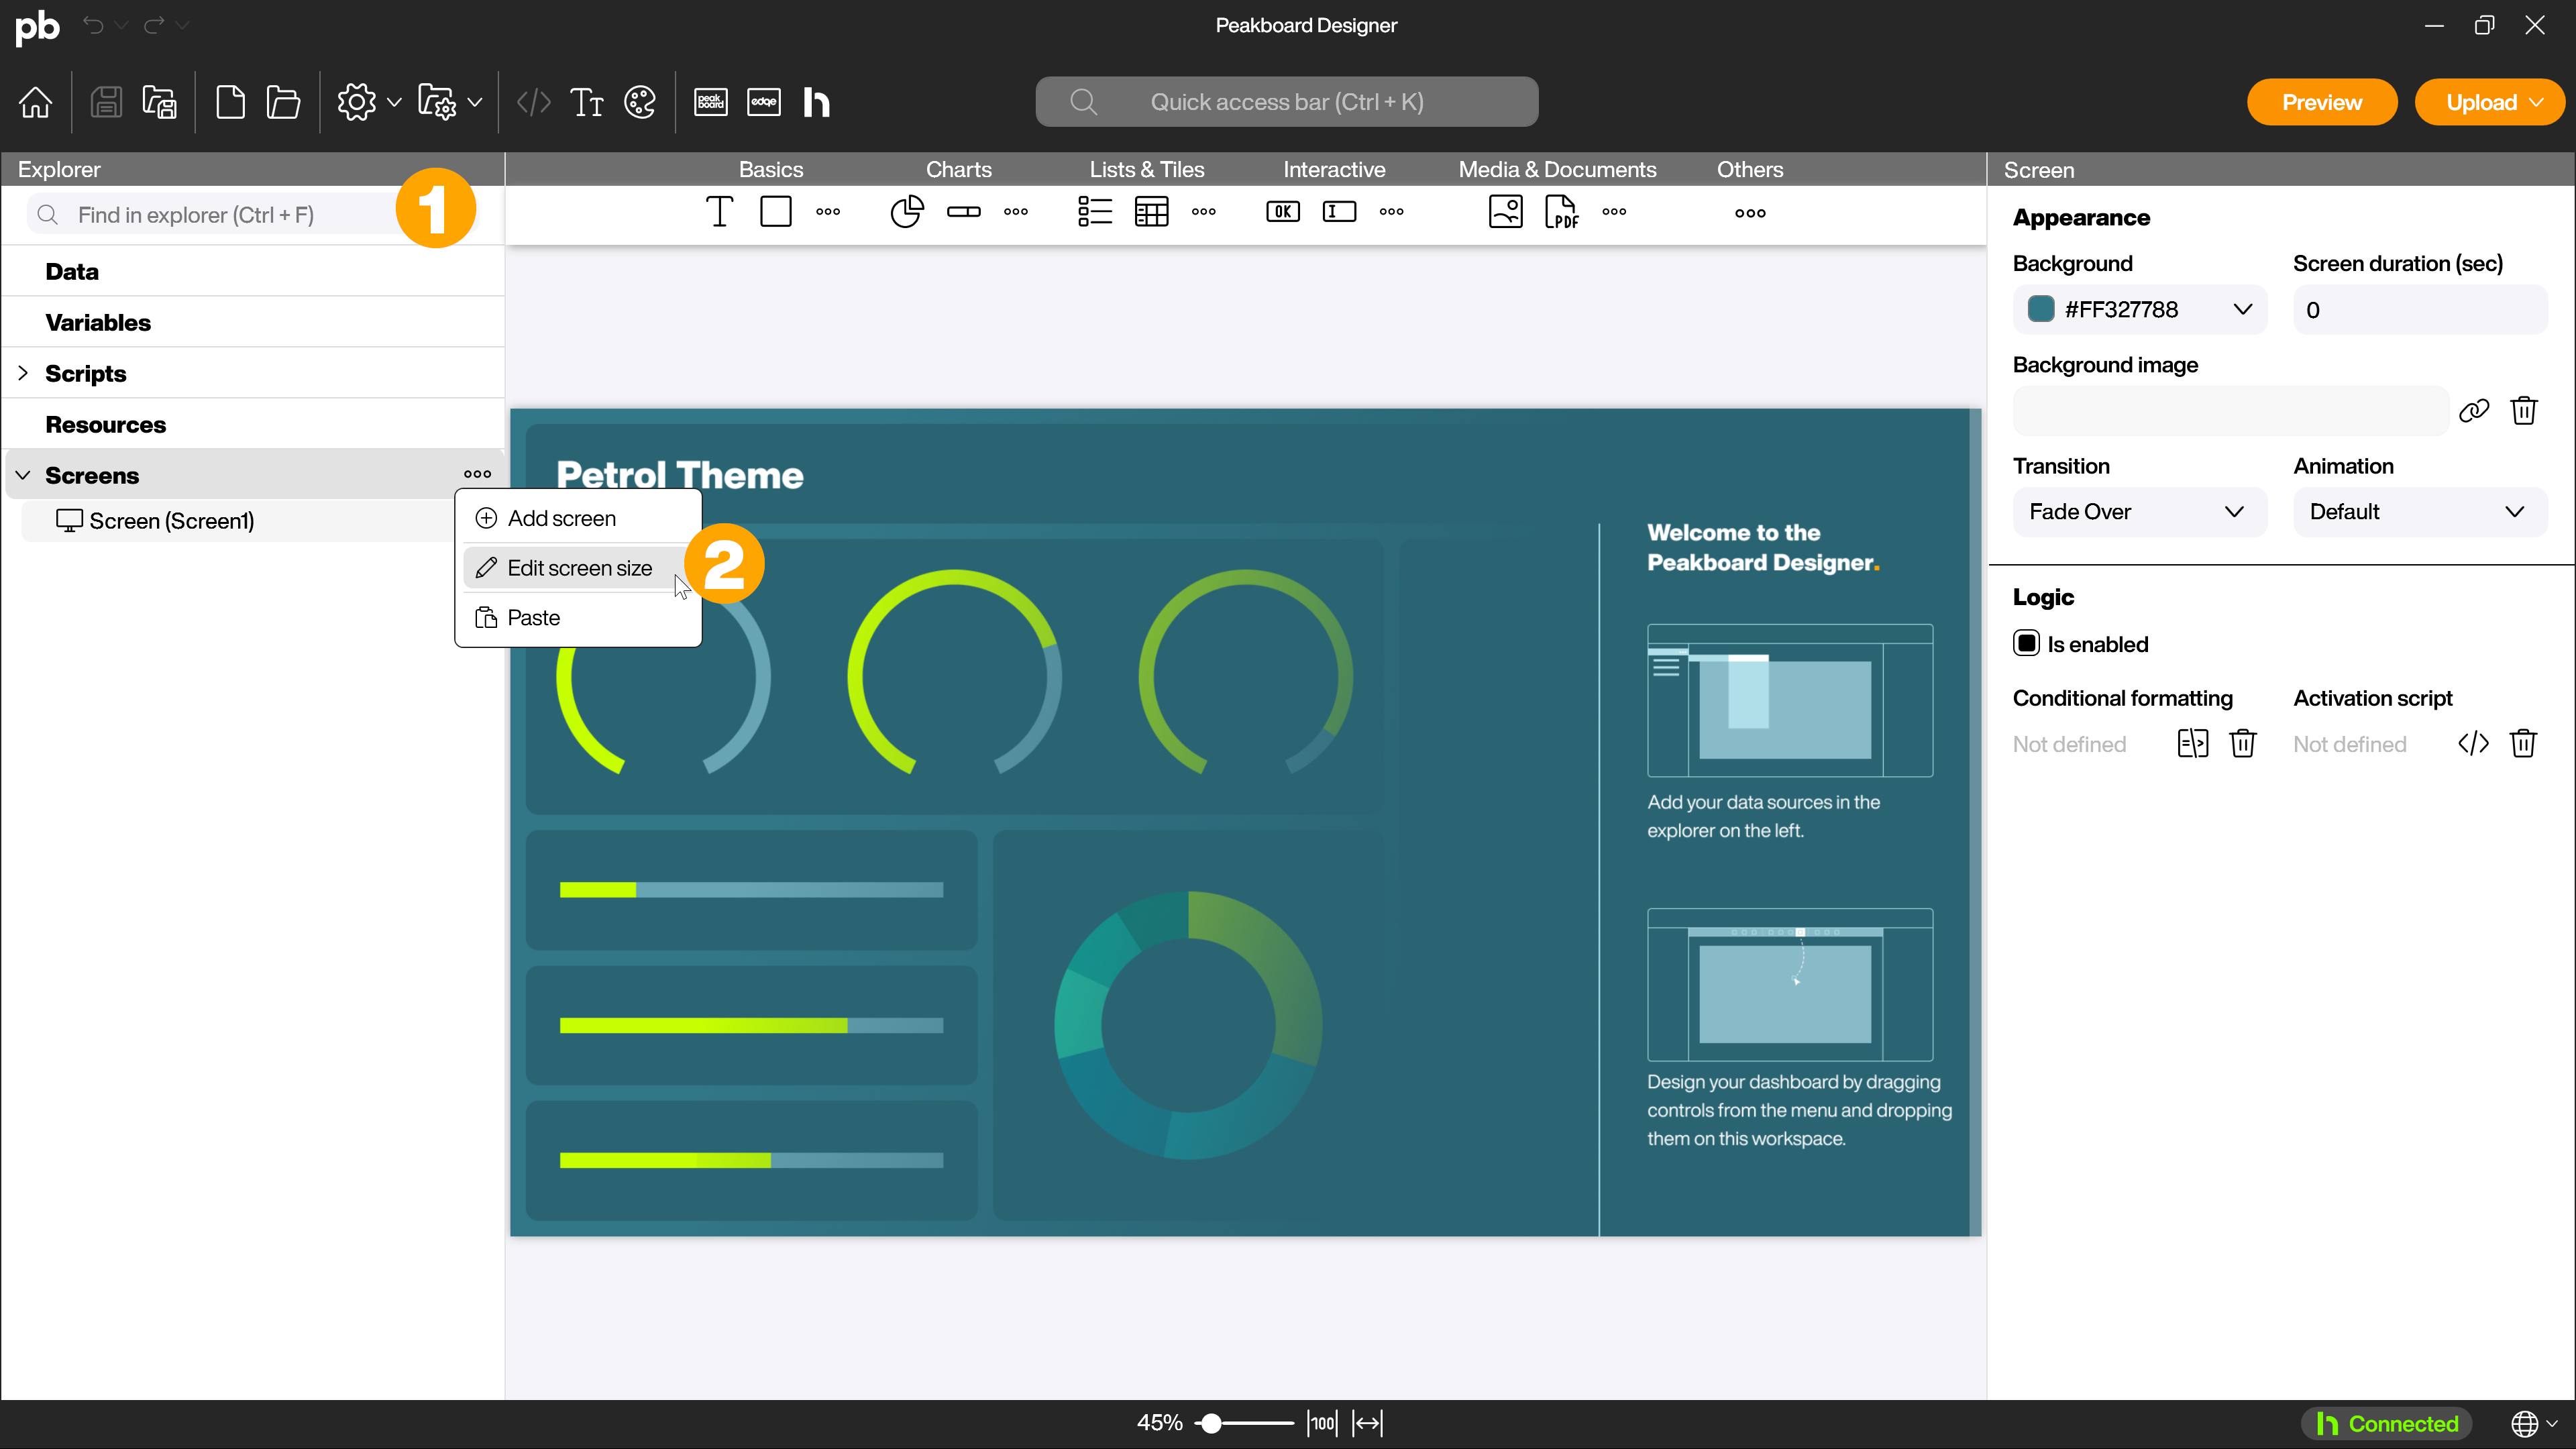
In the folder structure of the explorer all data sources, dataflows, variables, scripts and resources are displayed. In the last section [Screens] you will find a list of all existing visual controls on your workspace. Since we have not added any controls yet, the folders are empty at the moment. You can use the search bar (1) to search through the available elements in the explorer.
With a right click on the folders you can perform different actions - alternatively this also works with a click on […]. For example, open the menu item [Edit screen size] (2) with a right click on [Screens] to define the size of the visualization. For our example it is best to leave it at 1920x1080 (Full HD). The visualization will be automatically scaled to the resolution of the connected screen, but the aspect ratio should be correct.
In very extensive projects, the Explorer can become confusing due to the large number of elements despite the folder structure and subdivision into different categories. In addition to the search function, two other tools are available to help you maintain an overview.
Descriptions
So that you can see at a glance what the content of an element is, regardless of whether it is a data source, variable, script, resource or control, you can add a short description to each element. This description is then displayed with an [i symbol] behind the respective element and appears in a pop-up on mouseover. To add a description to an element, right-click on the element and select [Description].
Tags
To show a relationship or priority between the elements of the Explorer, you can add a tag to the elements of the Explorer. To do this, right-click on the desired element and select one of the six available colors under [Tag]. The element will be highlighted in the corresponding color.
A filter bar appears at the top of the Explorer, which you can use to filter according to the different tag colors. To do this, select one or more of the colors by clicking on them. To display all elements again, you can remove all filters by clicking on [Delete all].
2.3 The controls
For the different use cases you will find pre-built interface elements, which we call controls. They can be used and customized to visualize your data. From simple text fields, tables, simple charts like bar charts or pie charts, to sophisticated, combinable charts (Advanced charts) and repeatable interface patterns like the list or tile view, everything is available to you. Either drag and drop the elements onto the workspace or add them with a double click.
2.4 The attributes
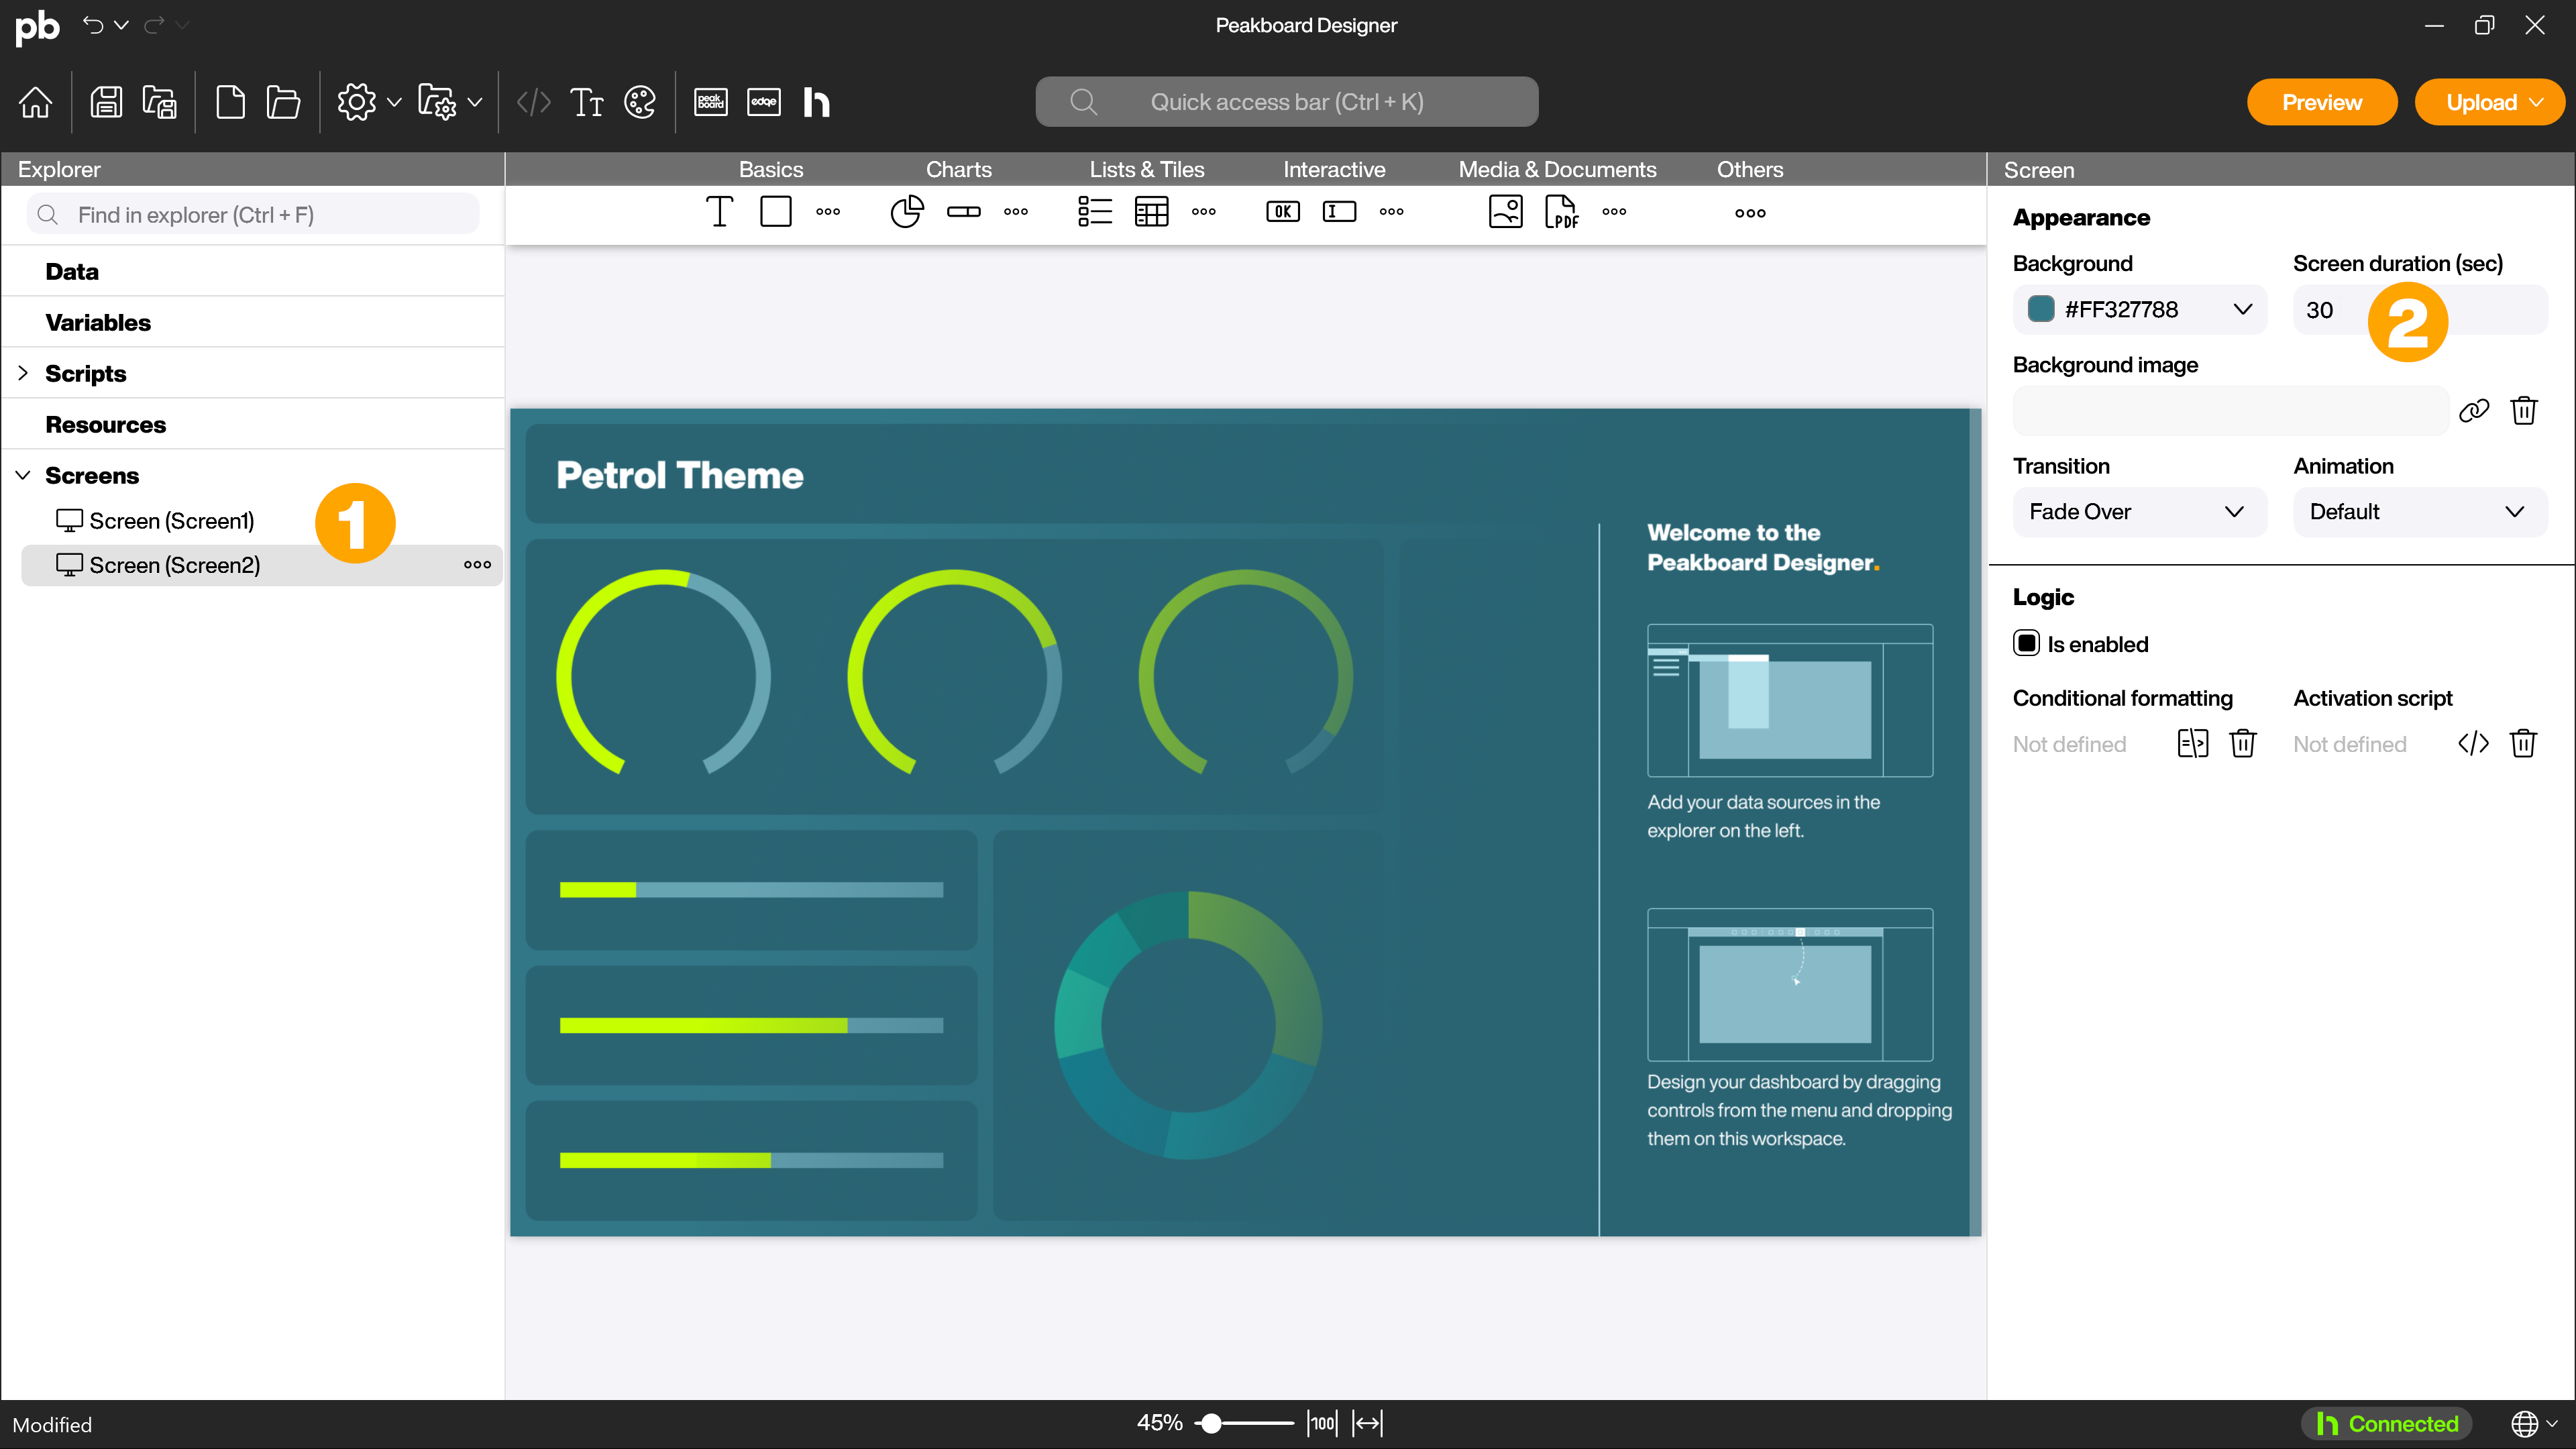
In the area to the right you will find the attribute overview. Here the respective adjustable parameters and attributes are listed for the currently active control. These parameters are different for each control. For example, try adding another screen by right-clicking on [Screens] in the Explorer. Now click on one of the screens and set the [Display duration] in the attributes under [General]. This display duration defines how long the respective screen remains visible before the next one is displayed.
3. Next steps
Now that you have a rough overview of the Peakboard Designer, you can start creating your first visualization. Of course, we will be happy to support you with our article The first visualization.
If you already have a Peakboard Box, the article The Peakboard Box will help you with your next steps.
If you have problems with the Peakboard Designer, don’t hesitate to contact us. We wish you a lot of fun and success with Peakboard!