Scripting
Colorize Table Grids
Table Grids are, unsurprisingly, the most common way of displaying tabular data. The Table Grid offers the possibility to bind data and adjust the columns as desired: font, orientation, formatting, heading, etc. - However, there are often attributes that should not be set statically, but rather depending on the data content. In addition, it may be useful to adjust the data contents before outputting them to the table if the standard formatting does not support this. This article deals with both requirements as examples:
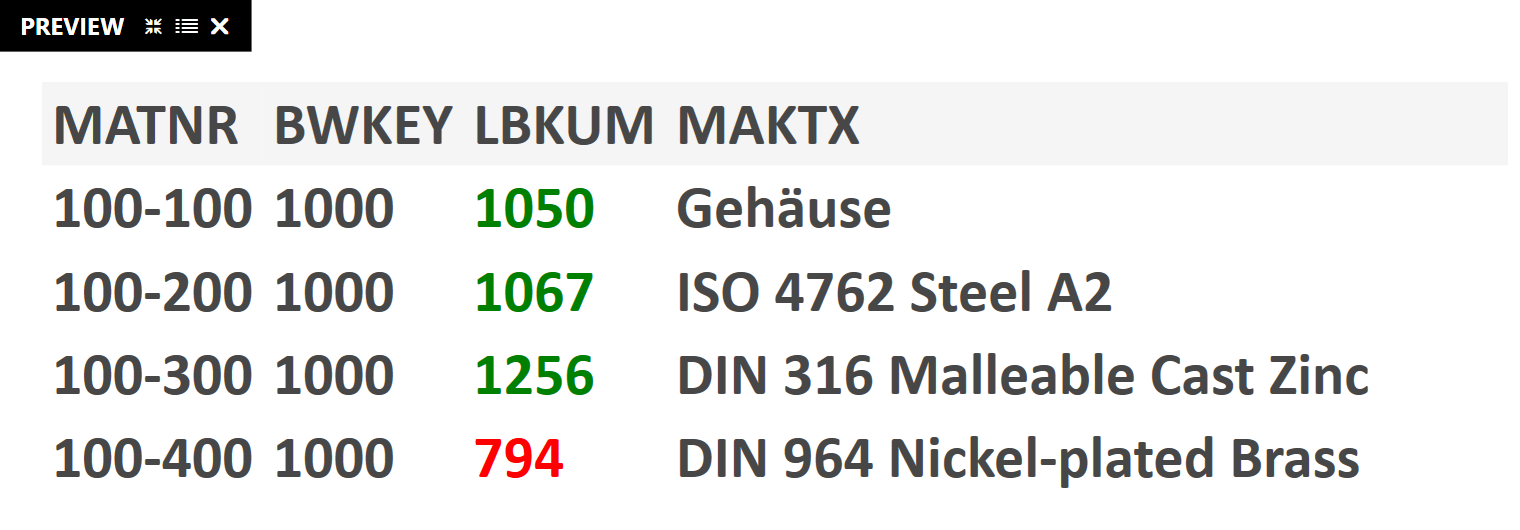
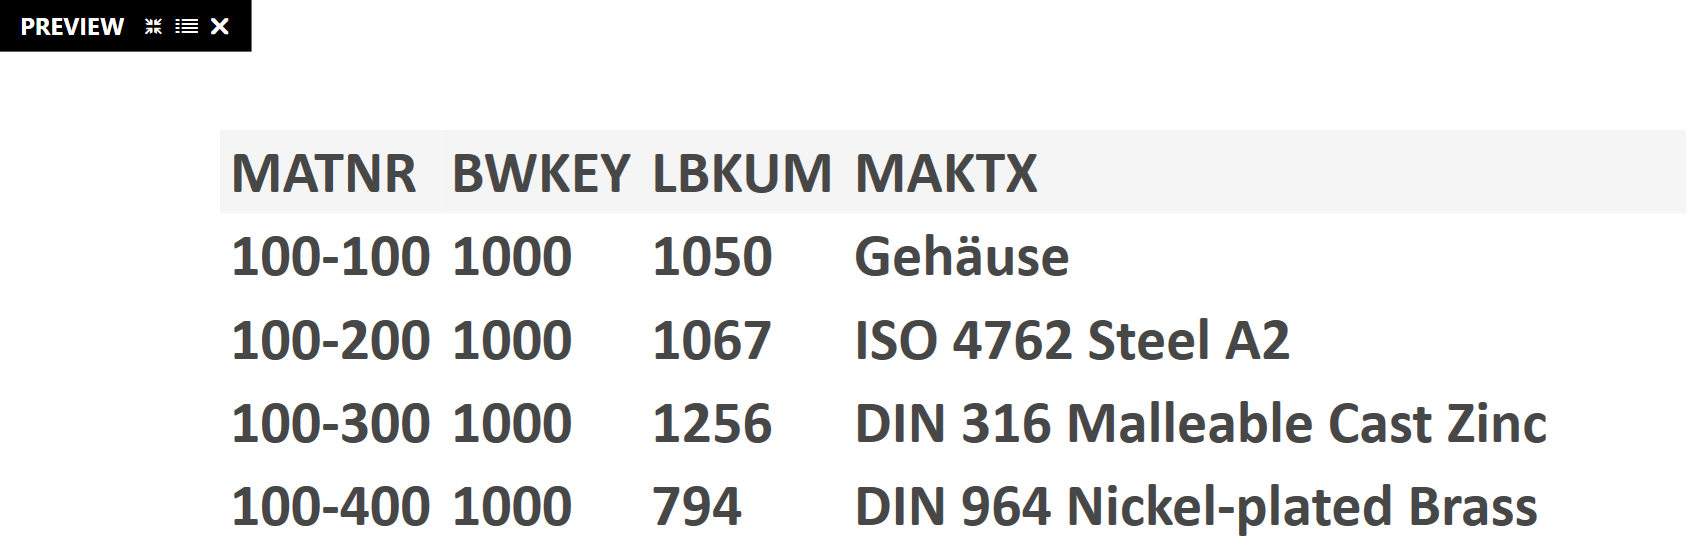
In the SAP table, those entries that have an entry greater than 1,000 in the column “LBKUM” should be displayed in green. Those that are smaller than 1,000 should be displayed in red.
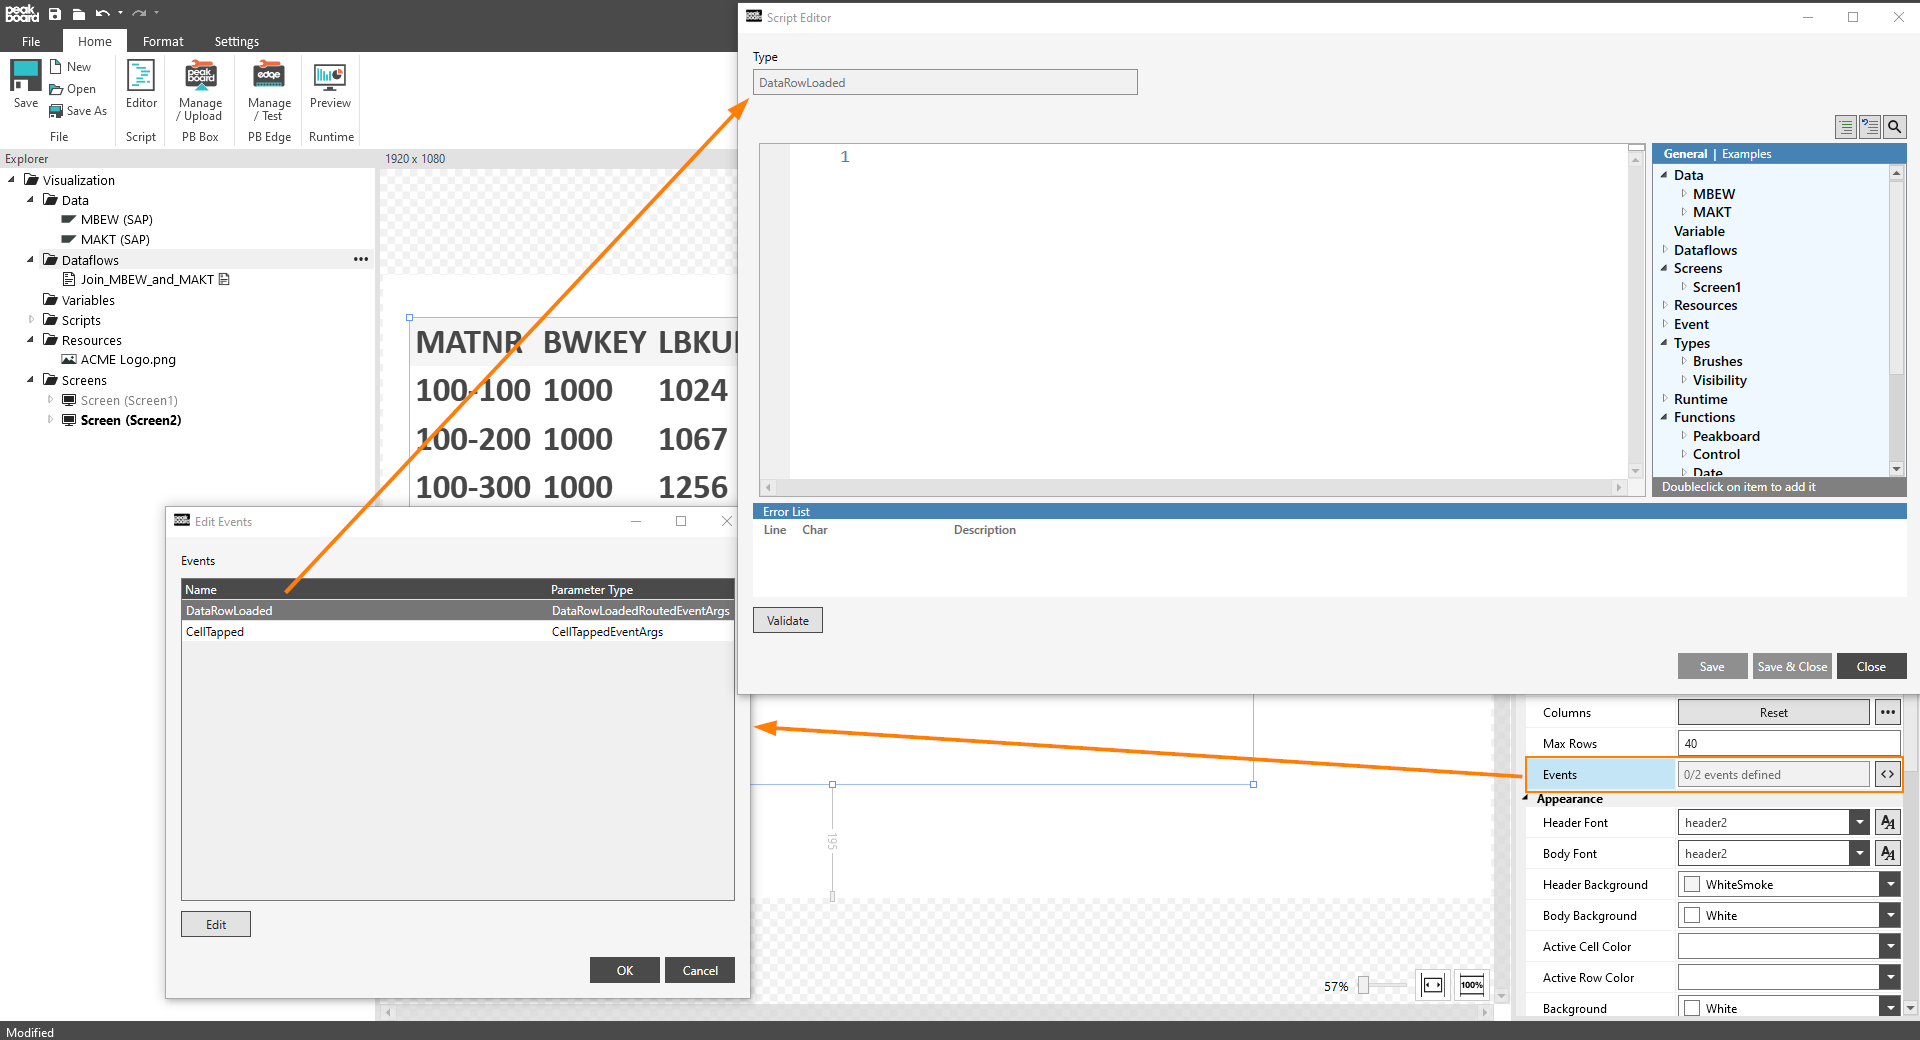
The formatting and change logic is mapped into a script. The script is run exactly once for each table row immediately before it is output in the visualization. You can access the script editor from the events attribute of the table grid element:
Within the event there is the variable e. It represents the current tabular line.
- e.Data gives access to the raw data (e.g. e.Data.MyData column).
- e.TextControl gives access to the control that represents the text (e.g. e.TextControl.Text = “My new content”) e.
- e.CellControl allows access to the cell itself (e.g. e.CellControl.Background = Brushes.Green) table.getcelltext(e, [Index]) returns the value of the column with the corresponding index. Here 0 corresponds to the first column, 1 to the second, …
This results in the following simple script to implement the requirements from above:
if math.tonumber(table.getcelltext(e, 2)) > 1000 then
 e.Columns[4].TextControl.Foreground = Brushes.Green
else
 e.Columns[4].CellControl.Foreground = Brushes.Red
end
Here the preview with the corresponding formatting script: